Date: Mon, Aug 04, 2025 | 05:15 AM GMT
The cryptocurrency market is making a slight recovery from the latest sharp decline as the price of Ethereum (ETH) has now bounced to $3,533 from its recent low of $3,357. Following this, notable altcoins have started to make upside moves — including Sonic (S).
Sonic (S) has been back on the green track today with modest gains, and its chart is now flashing a major bullish signal — a key harmonic pattern forming on the chart, pointing toward a potential upside move.
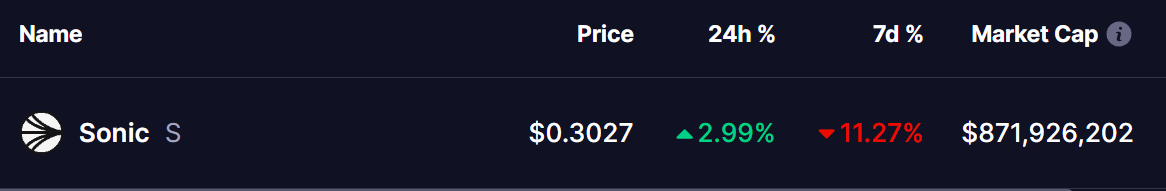 Source: Coinmarketcap
Harmonic Pattern Hints at Bullish Continuation
On the daily chart, S appears to be forming a Bearish Bat harmonic pattern, which often forecasts upward movement during the CD leg — the final stretch of the formation before potential reversal.
The structure began near $0.62 at point X, slid down to point A, rebounded to point B, and then dipped again to point C, hitting a low near $0.28. Since then, the token has begun to recover and is currently trading around $0.30. Right now, S is testing the 50-day moving average at $0.3289, a critical technical level.
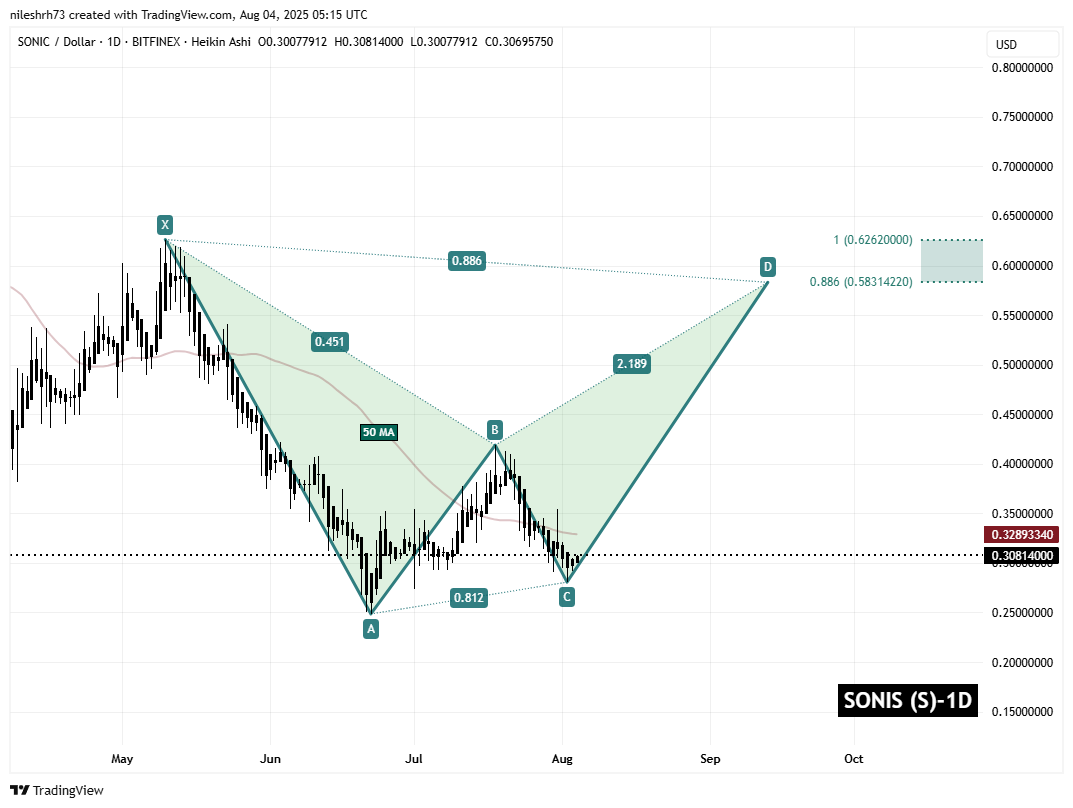 Sonic (S) Daily Chart/Coinsprobe (Source: Tradingview)
According to harmonic theory, the final bullish leg (CD) could drive the token toward its Potential Reversal Zone (PRZ) — which lies between $0.5831 and $0.6262. That’s more than 103% potential upside from the current price if the pattern plays out as expected.
What’s Next for Sonic?
For S to maintain this bullish trajectory, it must break and close above the 50-day MA with strong volume support. That could spark the beginning of a sustained rally toward the PRZ.
However, if the price fails to hold above the recent support near $0.2806, the setup may be invalidated — possibly delaying or derailing the bullish scenario.