Key Notes
- Over 1 billion DOGE were bought by whales in 24 hours, signaling major accumulation.
- DOGE dropped below key EMAs, while short liquidations near $0.208 triggered a $3M wipeout.
- The technical pattern shows DOGE in a bullish broadening wedge, with a long-term target of $1.40.
Dogecoin DOGE $0.20 24h volatility: 2.0% Market cap: $30.51 B Vol. 24h: $1.28 B saw a major shake-up in the past 24 hours, with 1 billion DOGE snapped up by whale addresses, according to analyst Ali Martinez.
The aggressive accumulation comes as the meme token trades at $0.2009, down nearly 10% for the week and slipping below key support levels, including its 20-day EMA ($0.2129) and 50-day EMA ($0.2060), according CoinMarketCap data .
Derivatives Data Reveals Turbulence, But Also Opportunity
According to CoinGlass , DOGE’s derivatives volume surged 2.43% to $4.82 billion in the last 24 hours, a sign of escalating interest. However, the open interest in DOGE futures contracts shrank to $3 billion.
This coincided with a $3 million liquidation in short positions, as the price gravitated near $0.208, a key cluster identified by TheKingfisher as a “short squeeze zone.”
🚨 $DOGE Liquidation map on all leverage just dropped.
Biggest short liquidation cluster is building up around $0.2079. This is a massive magnet for price.
Most traders are blind to this. Smart money uses this.
Long liquidations are scattered, showing less concentrated pain to… pic.twitter.com/CkYjOCj6FQ
— TheKingfisher (@kingfisher_btc) August 5, 2025
DOGE Price Analysis: Wedge Pattern Hints at Long-Term Rally
DOGE is forming an ascending broadening wedge on the weekly chart, an often volatile but bullish pattern. Trader Tardigrade points out that the last wedge swing ranged from $0.22 to $0.48.
$Doge /weekly #Dogecoin is moving within an ascending broadening wedge.
The next target at the top of the wedge is set at $1.4 🔥 pic.twitter.com/j5eYJOvojX— Trader Tardigrade (@TATrader_Alan) August 5, 2025
If history repeats itself, the next leg up could stretch to as high as $1.40. On the daily chart, DOGE is trading within an upward channel, now testing its lower support trendline, which aligns with the Bollinger Band lower boundary near $0.179.
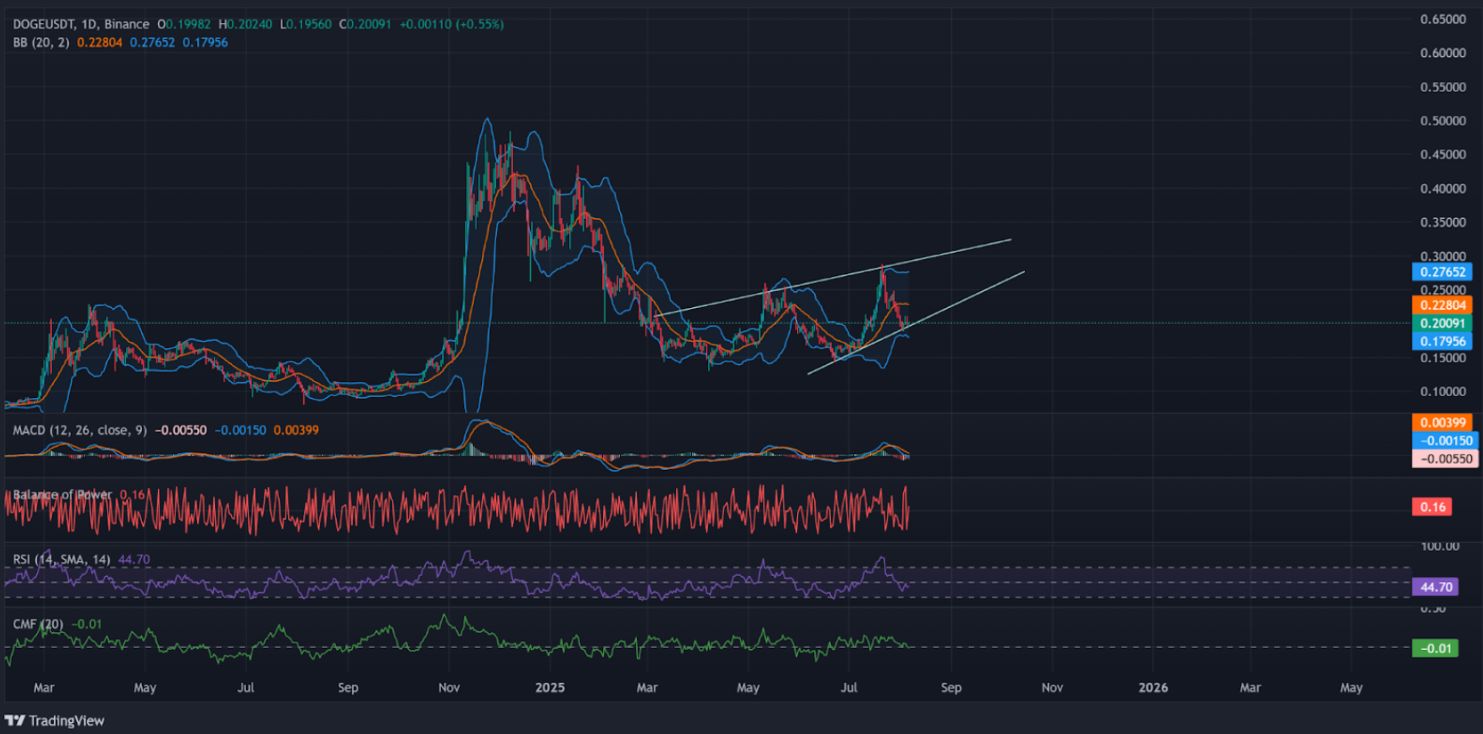
Dogecoin Daily Chart with Momentum Indicators | Source: TradingView
The MACD remains bearish with a negative crossover, while RSI sits at 44.7, just shy of oversold territory.
The Chaikin Money Flow (CMF) is hovering at -0.01, suggesting capital outflows are tapering off. Together, these indicators reflect a market that’s cooling but not collapsing.
Whale Buys Meet Retail Hesitance
While whale activity often precedes major price shifts , retail investors remain cautious. The current “sell wall” effect, caused by large liquidations and profit-taking at resistance zones like $0.208 and $0.228, adds further overhead pressure.
However, any decisive move above these levels could flip sentiment quickly and trap over-leveraged shorts. But DOGE will still remain as one of the best meme coins to buy .
Whether DOGE rebounds toward its upper wedge resistance or continues its slow bleed will likely depend on whether whales continue to buy and if retail follows.
next