Key Notes
- OMNI surged 25% in 24 hours following a 770% increase in trading volume.
- The token broke out of a long-term descending wedge, signaling trend reversal.
- Despite the rally, OMNI struggles to hold above the key $5 support level.
Omni Network OMNI $4.87 24h volatility: 23.5% Market cap: $190.05 M Vol. 24h: $408.82 M shot up 25% in the past 24 hours following a massive 770% increase in trading volume. The token reached an intraday high of $5.35 before retreating to $4.83 at the time of writing.
The sudden jump provides a much-needed relief to investors following recent struggles as OMNI remains 83.9% below its all-time high of $29.93.
OMNI hit rock bottom just a month ago, touching a historic low of $1.37. Since then, the asset has shown strong signs of recovery.
However, the token has not yet managed to hold above the $5 mark, a solid support level if sustained .
Wedge Breakout Triggered OMNI Rally
A key factor behind OMNI’s explosive move appears to be a clear breakout from a long-standing descending wedge pattern. The formation, visible on the daily chart, had been containing the token’s price since early April.
$OMNI broke the falling wedge.
Retest holding strong.
Next leg could send it +270%.
Momentum’s real. pic.twitter.com/SRXhFoHft2
— Smith (@CryptoSmith0x) August 7, 2025
The wedge’s narrowing structure signaled decreasing volatility, but the eventual breakout to the upside confirmed a potential shift in trend.
The breakout followed an expansion in the Bollinger Bands, indicating rising volatility. The price climbed above the 20-day simple moving average, which often acts as a short-term trend guide, reinforcing the strength of the breakout.
OMNI Price Analysis: Momentum Is Building
The MACD has made a bullish crossover, suggesting a potential beginning of a new uptrend. However, the histogram remains relatively flat, indicating that the strength of this trend has not yet matured.
The RSI currently stands at 67.5, just below the overbought threshold and the BoP indicator also currently favors buyers.
However, the CMF remains in negative territory at -0.20, suggesting that capital inflows have not yet fully supported the price rise.
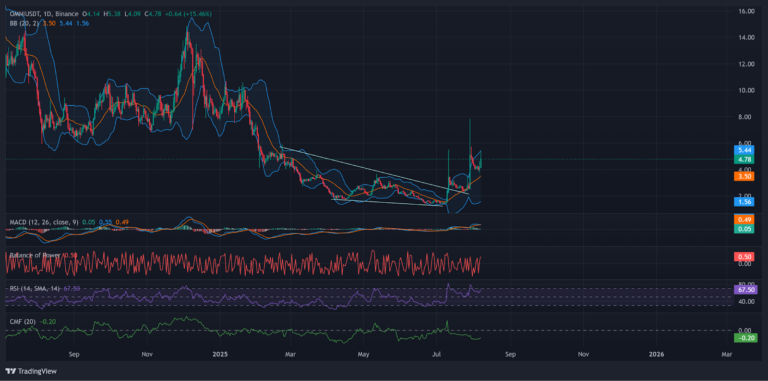
OMNI daily chart with momentum indicators. | Source: TradingView
If OMNI is able to turn $5 into support, the next resistance is located around $5.44, which is aligned with the upper Bollinger Band.
A break above this zone might allow OMNI to approach the $6.30 to $6.50 range, where previous price action encountered selling pressure in late 2024. If momentum continues, a move toward $8 could also come into play.
On the other hand, if OMNI drops below the $4 to $3.50 zone, the bullish structure could weaken. In that case, support would be near the 20-day moving average, followed by the lower boundary of the wedge, around $2.90.
A further breakdown could drive prices toward the $2 region, potentially placing OMNI at risk of retesting its all-time low.
![[Bitpush Daily News Highlights] Texas Lieutenant Governor officially announces the purchase of bitcoin, aiming to build America’s digital future hub; Economists expect the Federal Reserve to cut interest rates in December, with two more possible cuts in 2026; Circle has issued an additional 10 billions USDC in the past month; Sources: SpaceX is in talks over share sales, with valuation possibly soaring to 800 billions USD.](https://img.bgstatic.com/multiLang/image/social/dd58c36fde28f27d3832e67b2a00dab41764952203123.png)