
Stellar (XLM) Price Breaks Out With 100% Rally in Sight; But One Risk Remains

Stellar (XLM) price is showing signs of a major rally after a clean breakout. But one key on-chain metric hints at possible early profit-booking. Will it stall the move?
Stellar (XLM) price has jumped over 16% in the past 24 hours, breaking out of a bullish continuation pattern. While many traders might expect a pullback, several technical indicators suggest this could be the beginning of a much bigger rally.
However, one on-chain metric throws in a caution flag that could slow things down.
Triple EMA Crossover Shows Strong Uptrend Setup
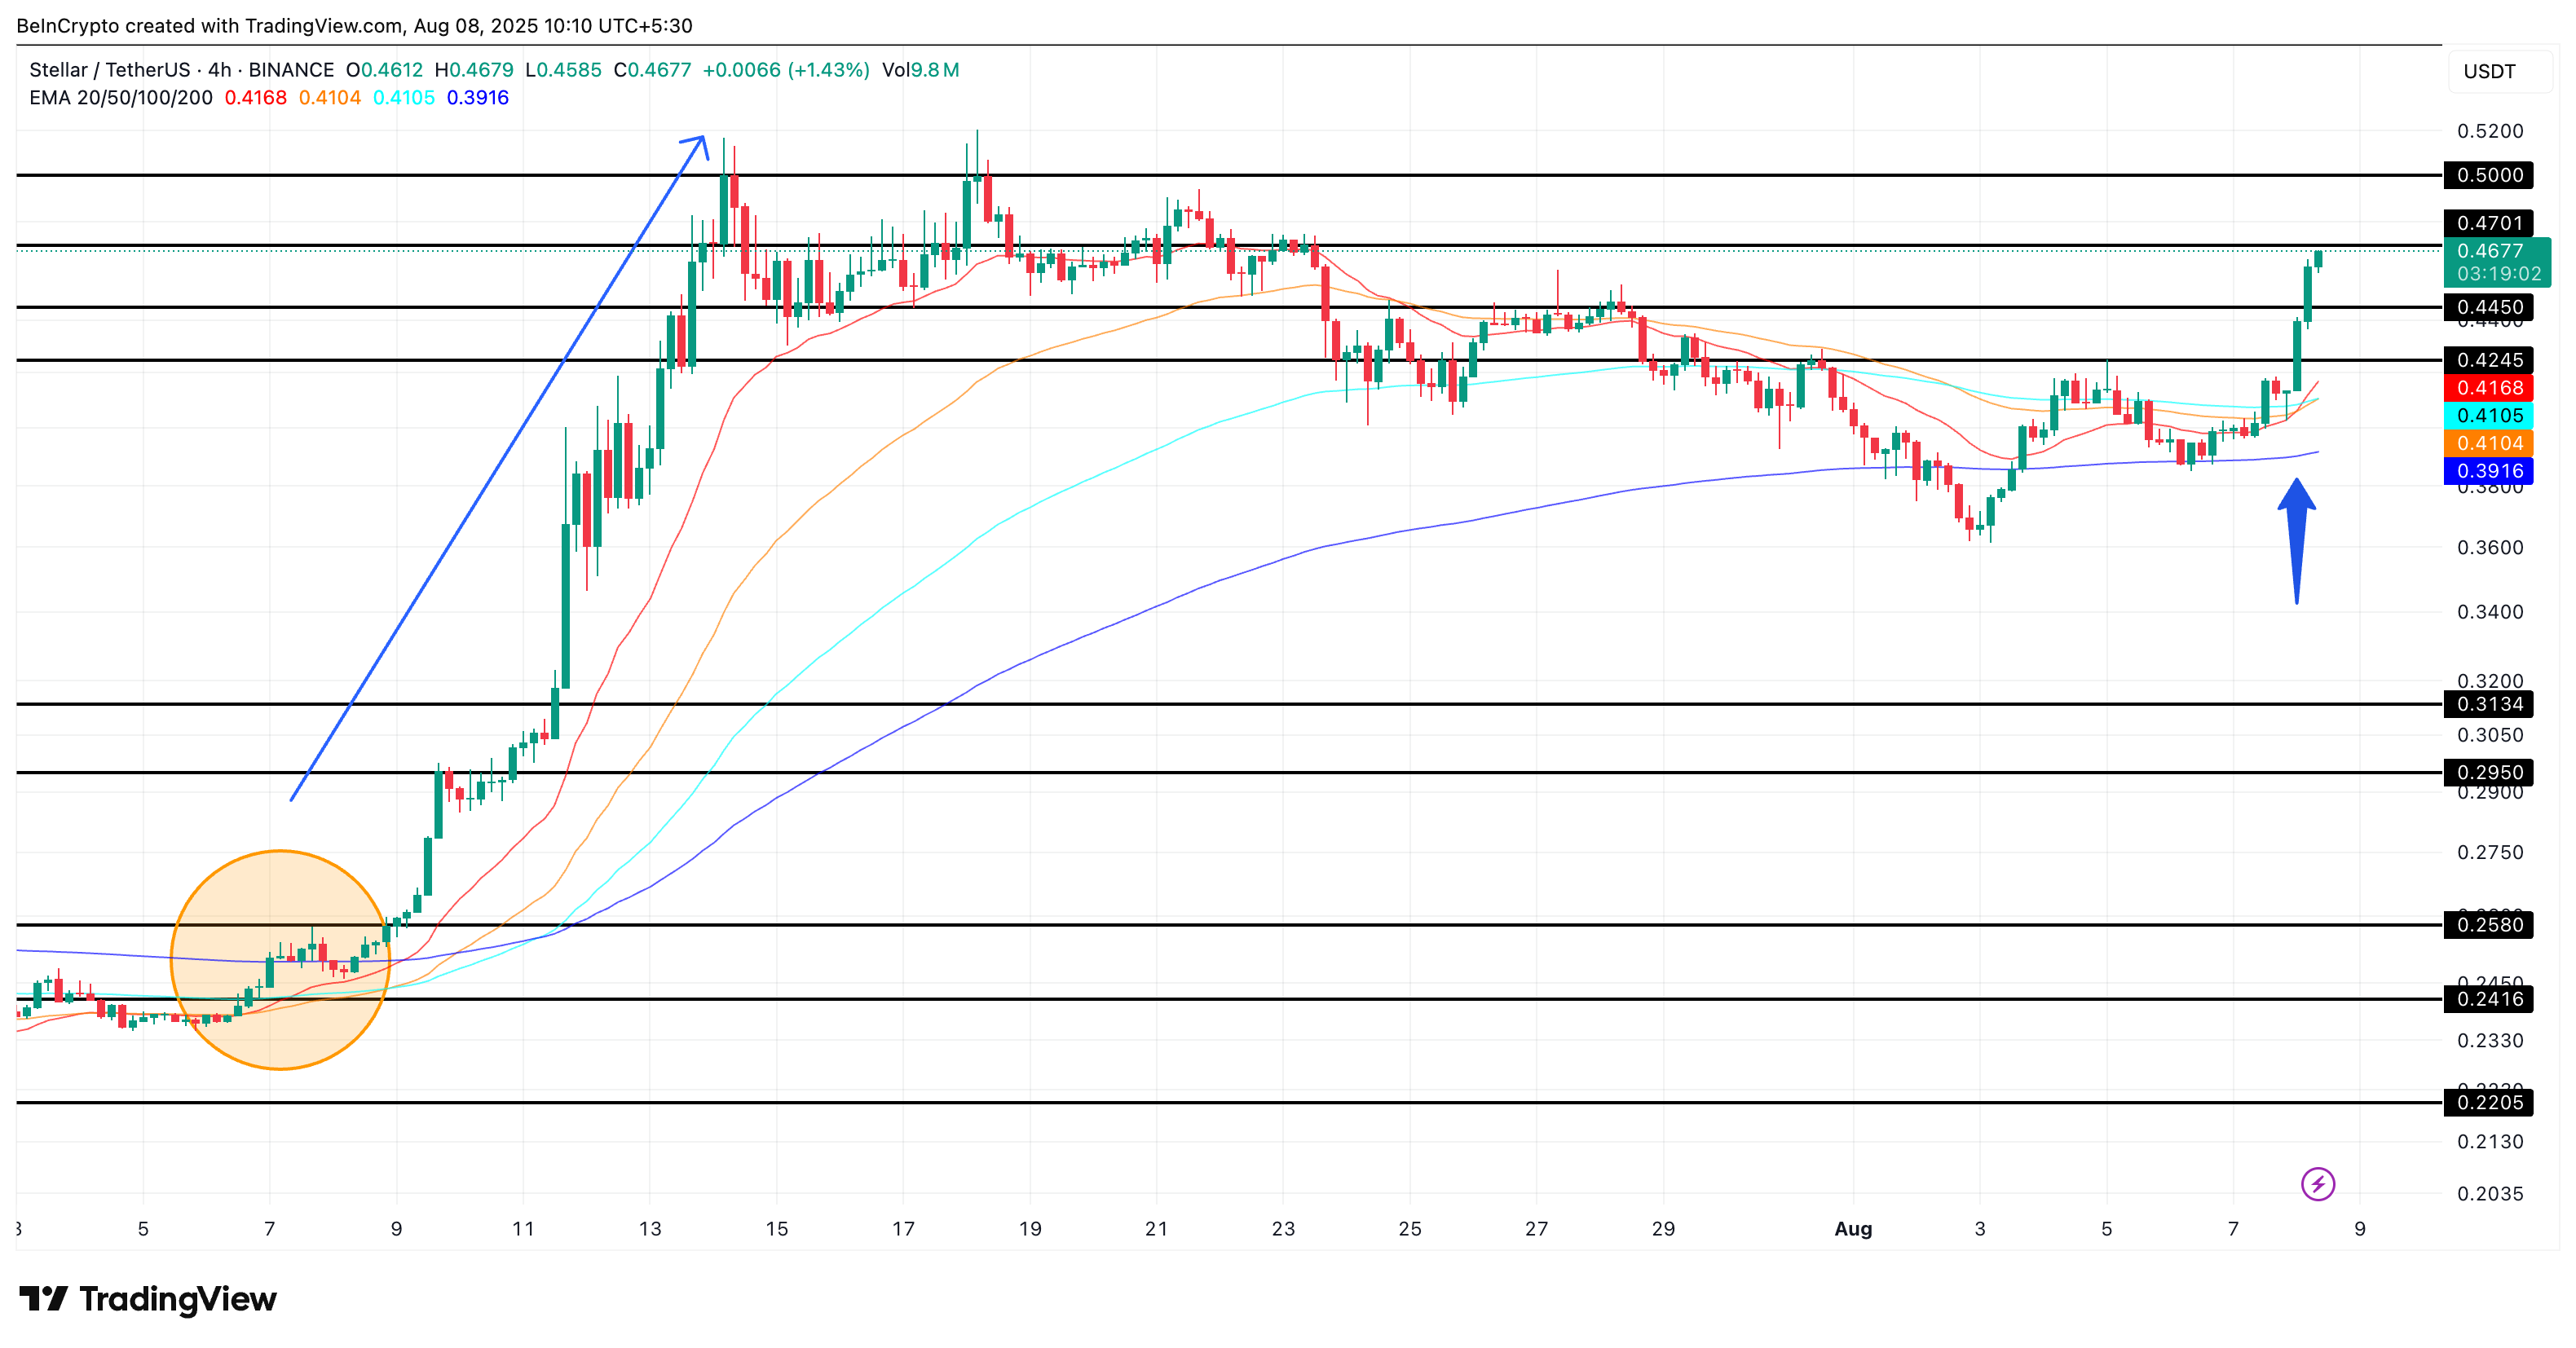
The 4-hour chart gives a clear view of trend momentum, and this is where the triple EMA crossover begins to show strength. The 20-period exponential moving average (EMA) has already crossed above both the 50 and 100 EMAs, and the 50 EMA is now closing in on a similar crossover above the 100 EMA.
 Stellar price and triple crossover:
An exponential moving average (EMA) is a technical tool that smooths price data, placing more weight on recent prices. It reacts faster to recent movements compared to a simple moving average (SMA). A “Golden Cross” occurs when a shorter EMA crosses above a longer one, commonly used by traders to confirm bullish trend reversals.
Historically, the last time this triple crossover setup occurred (in early July), Stellar price jumped from $0.23 to over $0.52; a 122% rally, give or take. This setup builds strong technical momentum as the price currently pushes above $0.46, with $0.50 as immediate psychological resistance and the $0.52–$0.97 range as the bullish extension zone.
For token TA and market updates: Want more token insights like this? Sign up for Editor Harsh Notariya’s Daily Crypto Newsletter.
Netflows Show Early Profit-Taking Risk
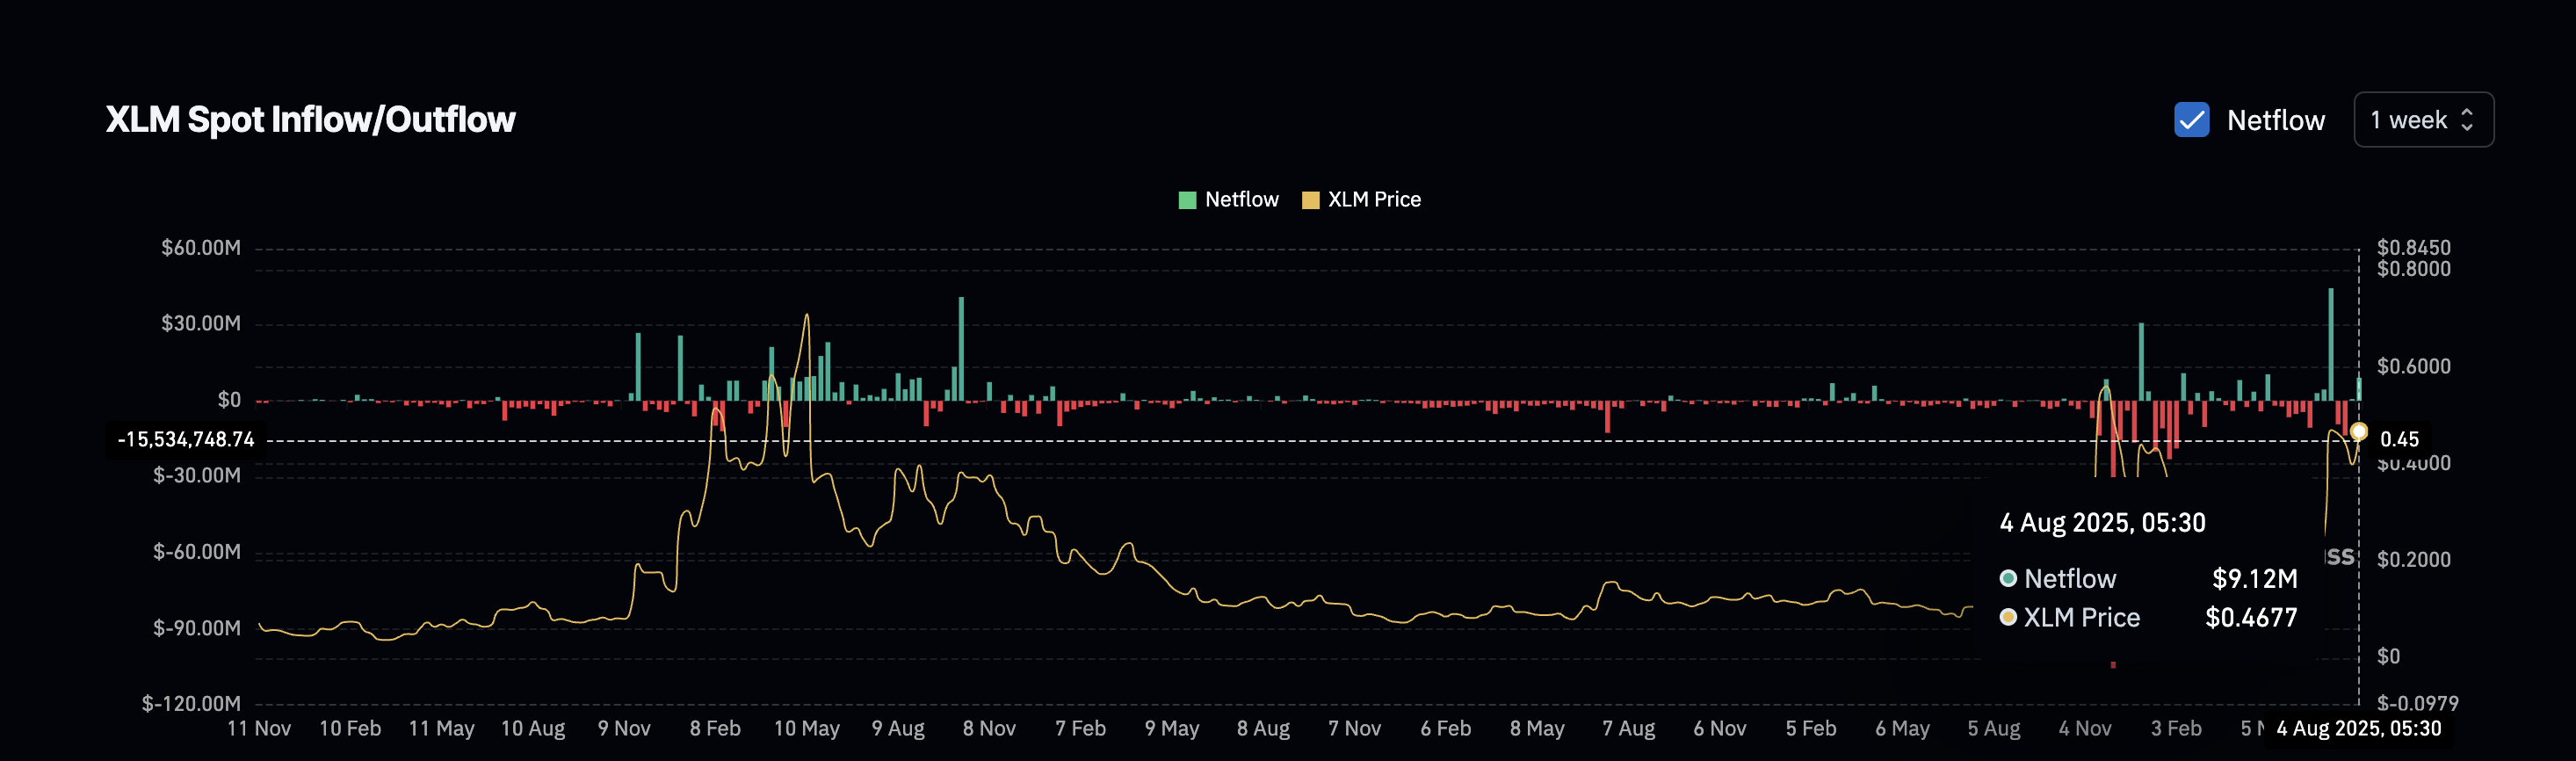
The one-week spot exchange netflow chart shows a jump from just $724,000 in the previous week to $9.12 million this week; an increase of over 1,159%. This metric tracks how much XLM is flowing onto or off exchanges. When flows rise, it usually signals traders moving tokens to exchanges to potentially sell.
 XLM Inflows increase after a few muted weeks:
This isn’t the first time this has happened. On June 23, 2024, netflows also flipped positive, and the Stellar price dropped from $0.26 to $0.24 shortly after. Another instance was on December 30, 2024, when a similar surge (after weeks of silence) in exchange inflows led to a short-term price correction.
So while the technical setup looks bullish, traders should stay alert for potential pullbacks triggered by profit-booking pressure in the coming sessions.
Bull-Bear Power Index Validates the Stellar Price Breakout
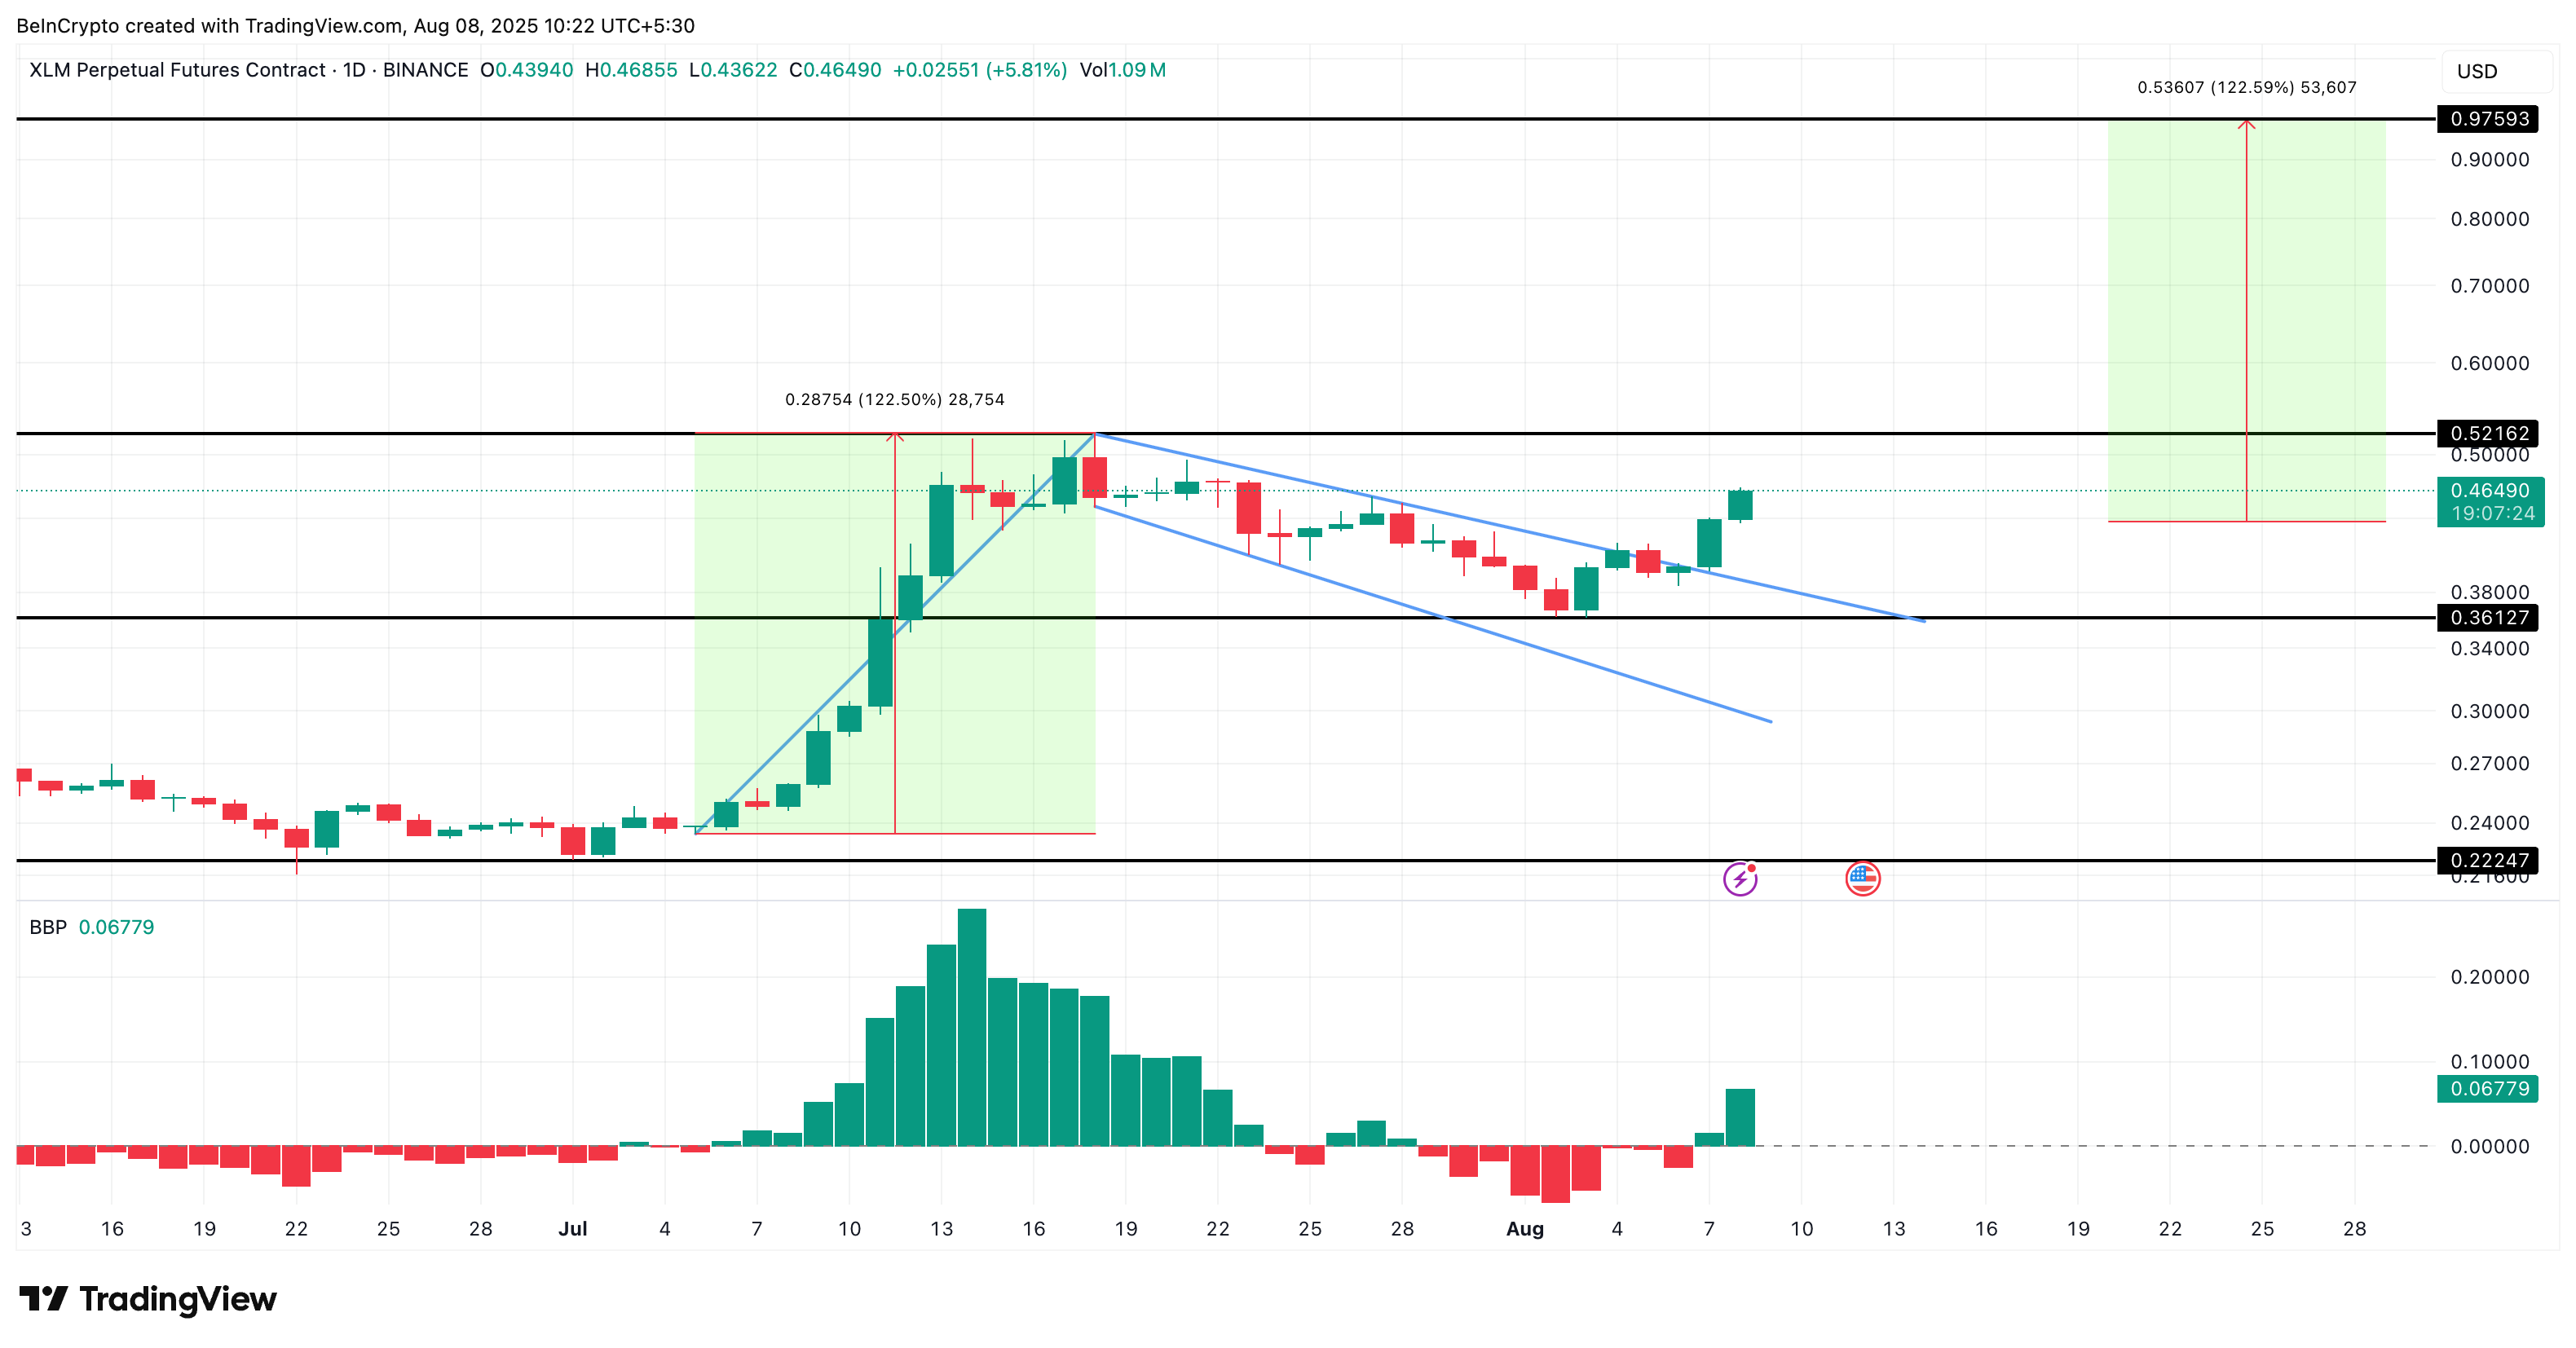
The pole-and-flag breakout on the daily chart adds further strength to the bullish argument. It starts with a strong price run (the pole), followed by a slanted consolidation (the flag), and a breakout usually leads to another leg up.
 Stellar price analysis:
What makes this case stronger is the Bull-Bear Power (BBP) index, which has flipped green again. This indicator shows the difference between the highest price buyers were willing to pay and the lowest price sellers accepted. A green BBP during a breakout usually confirms that buying strength is returning.
With the pole measured from the $0.23 bottom to the $0.52 top, the same extension from the breakout candle’s close puts the next Stellar price target near $0.97, assuming the rally continues. Do note that the pole comprises the same XLM price rally zone that was previously mentioned as part of the concluded triple crossover. To form a clean upside move, Stellar price must first cross $0.52, the previous swing high, or the highest point of the pole.
However, the short-term bullish hypothesis gets invalidated if the Stellar price falls under $0.36, primarily led by increased selling pressure, as highlighted earlier.
Disclaimer: The content of this article solely reflects the author's opinion and does not represent the platform in any capacity. This article is not intended to serve as a reference for making investment decisions.
You may also like
Future Contracts Tap into Altcoin Potential at CME Group
$7.8 Billion and Growing: What Iran’s Crypto Data Reveals About Crisis
Why is Sweetgreen's business struggling?