The cryptocurrency market is seeing a slight cooldown as Ethereum (ETH) touched $4,331 before pulling back to around $4,185. This short-term retreat is spilling over into several major altcoins — including Artificial Superintelligence Alliance (FET).
FET has delivered an impressive 10% weekly rally before turning red today. More importantly, its latest price action is flashing a familiar pattern that could hint at its next move.
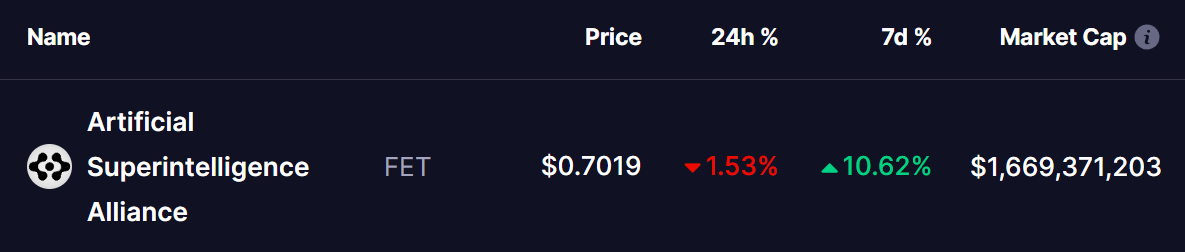 Source: Coinmarketcap
Familiar Pattern Hints at Potential Pullback
On the daily chart, FET is trading inside a descending channel — a structure that can be bullish over the longer term, but is now showing short-term caution signals. Within the channel, a bearish ABCD fractal pattern has re-emerged, echoing a setup from earlier this year.
In mid-June, FET was rejected at the “C” point and broke down from both the 25-day and 50-day moving averages (MAs), triggering a 33% plunge toward the Potential Reversal Zone (PRZ) and lower channel support around $0.55.
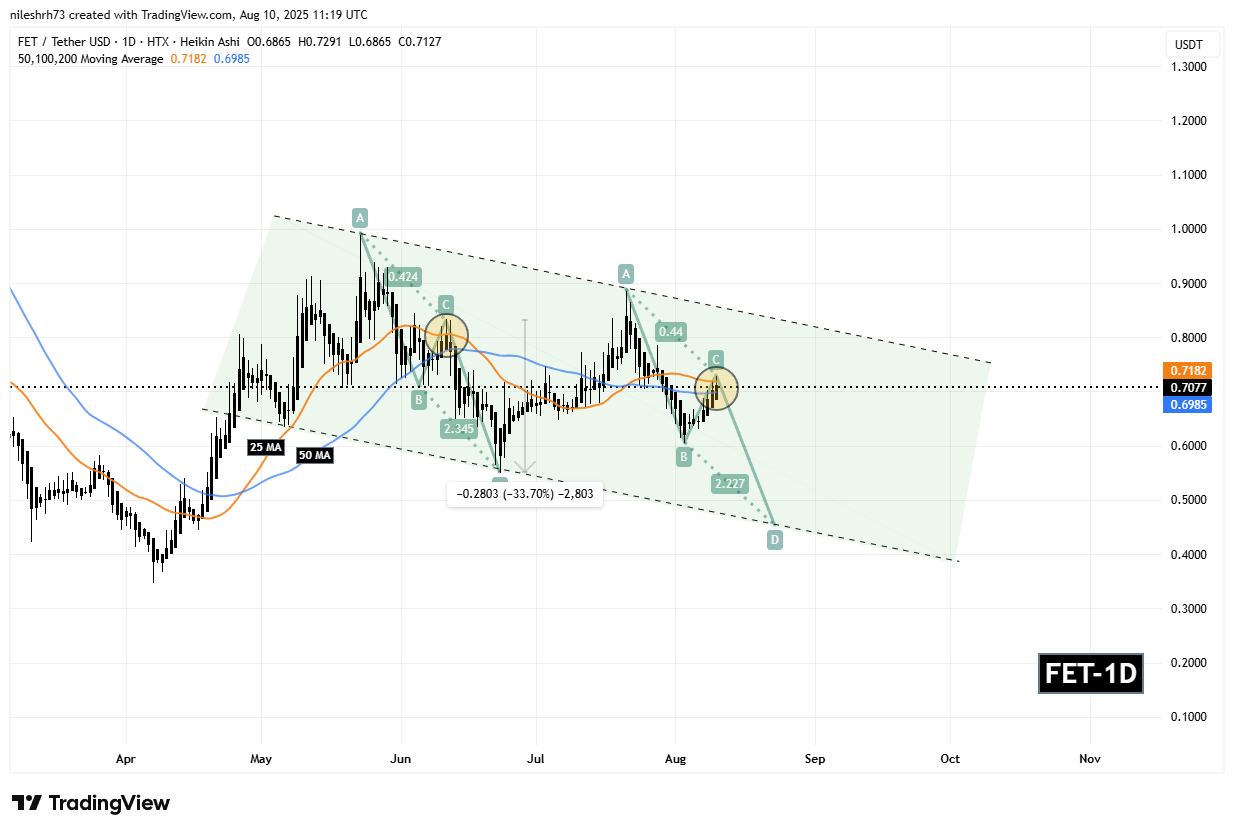 FET Daily Chart/Coinsprobe (Source: Tradingview)
Today’s chart looks strikingly similar. FET is once again showing signs of rejection from the C point at $0.7291 and is now trading below its 25-day MA, hovering just above the critical 50-day MA support at $0.6985 — a technical setup that could pave the way for another leg down.
What’s Next for FET?
If history repeats and the fractal holds, a decisive breakdown below the 50-day MA could be the trigger for another correction, potentially driving FET back toward the PRZ and lower channel support near $0.4447 — representing a drop of roughly 36% from current levels.
However, bulls aren’t out of the game yet. A successful reclaim and hold above $0.7291 would invalidate the bearish setup and could open the path for a renewed upside push.