Dogecoin is currently testing the $0.30 resistance level for the third time in 2025, while maintaining a long-term rising channel with key support levels intact.
-
DOGE has faced rejection at $0.30 three times this year, establishing it as a significant barrier.
-
Price remains within an 11-year rising channel, preserving its bullish structure.
-
Lower timeframe momentum is cooling, yet major support levels remain unbroken.
Dogecoin is testing $0.30 resistance for the third time in 2025, maintaining its bullish structure with key support levels intact. Read more for insights.
What is Dogecoin’s Current Price Action?
Dogecoin is currently locked between major support and resistance levels as it battles the $0.30 mark for the third time this year. Historical patterns and technical signals suggest that the next potential move is being closely monitored by traders.
Why Has Dogecoin Faced Repeated Rejections at $0.30?
Data from March to August 2025 shared by Ali Charts on X indicates that Dogecoin’s price action has been capped by the $0.30 mark. The first rejection in March saw the price fall below $0.26 and slide to $0.17. The coin then traded sideways between $0.17 and $0.22 for weeks. In May, a brief push toward $0.26 ended in another pullback.
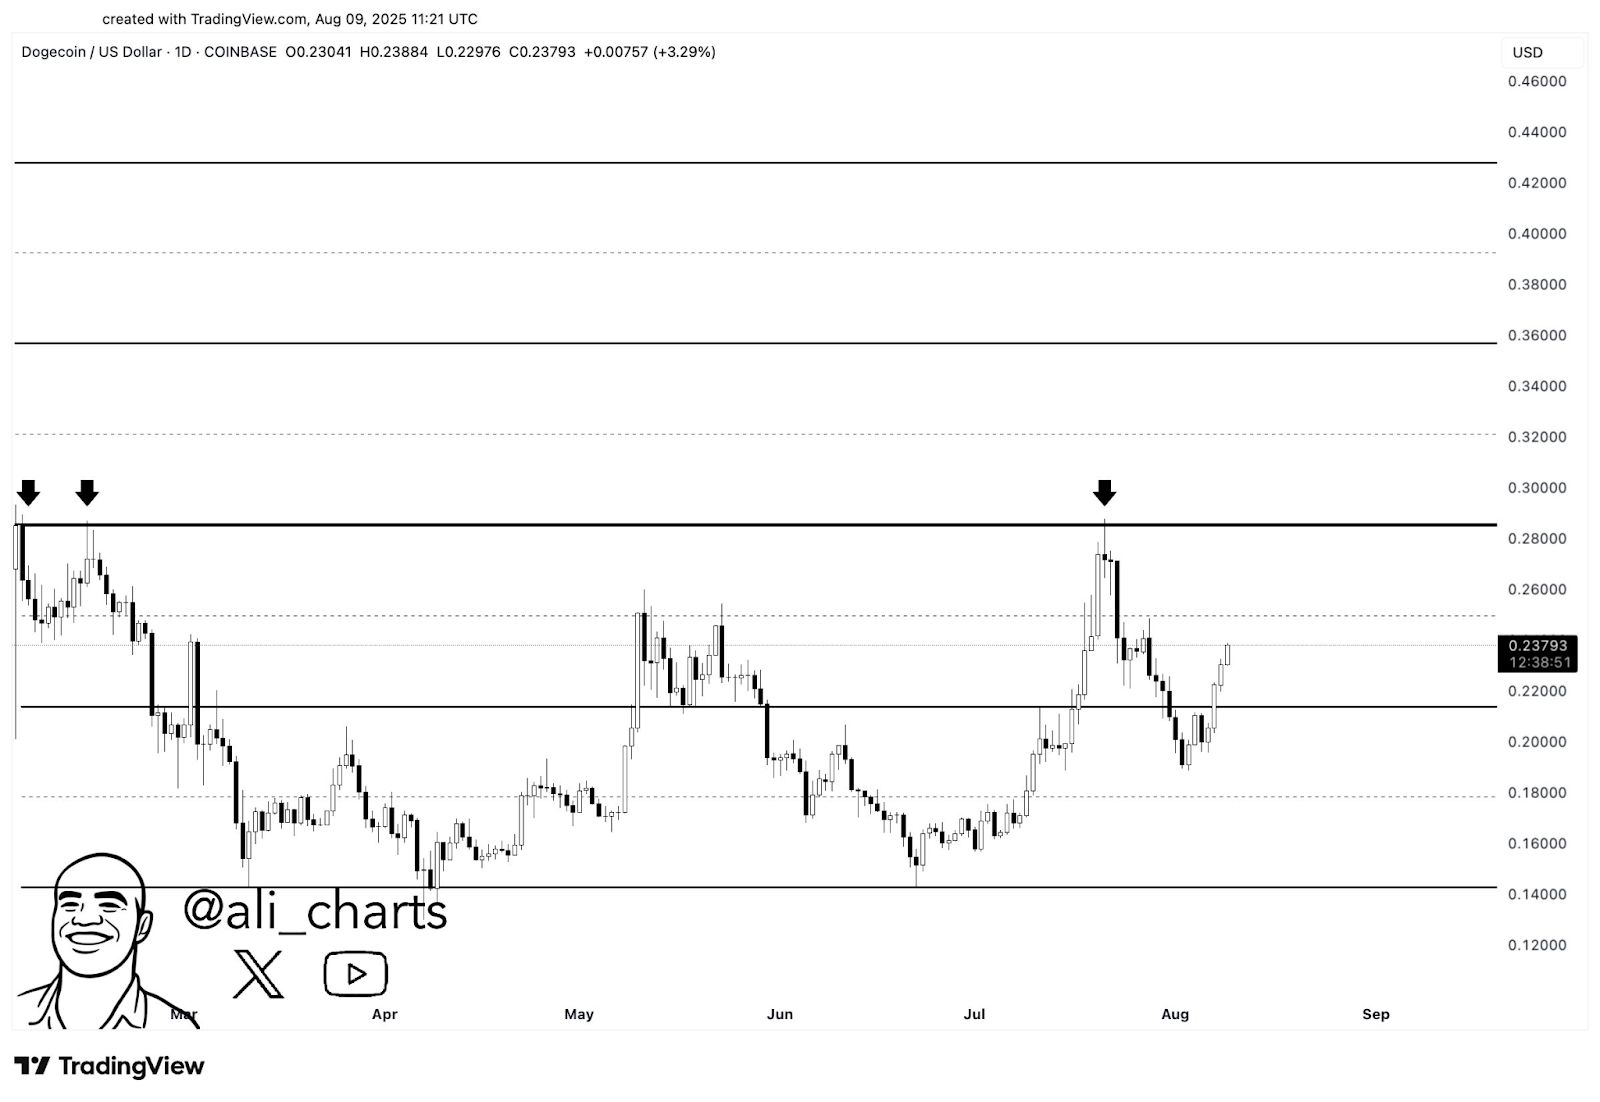 Source: Ali Charts
A sharp rally in early July took DOGE above $0.26 and back to $0.30, but the level held firm. The rejection sent the price down to $0.21 support in late July. A bounce followed, with current trading around $0.23669 — still below the $0.26 resistance but above the $0.22 support.
How Does Dogecoin’s Long-Term Channel Affect Its Price?
Biweekly data from 2014 to 2025 shows DOGE trading within a wide ascending channel. Major rallies in 2017, 2021, and 2024 began near the lower trendline. The 2021 peak reached $0.73665 before a steep correction, but the price never broke the channel’s lower boundary.
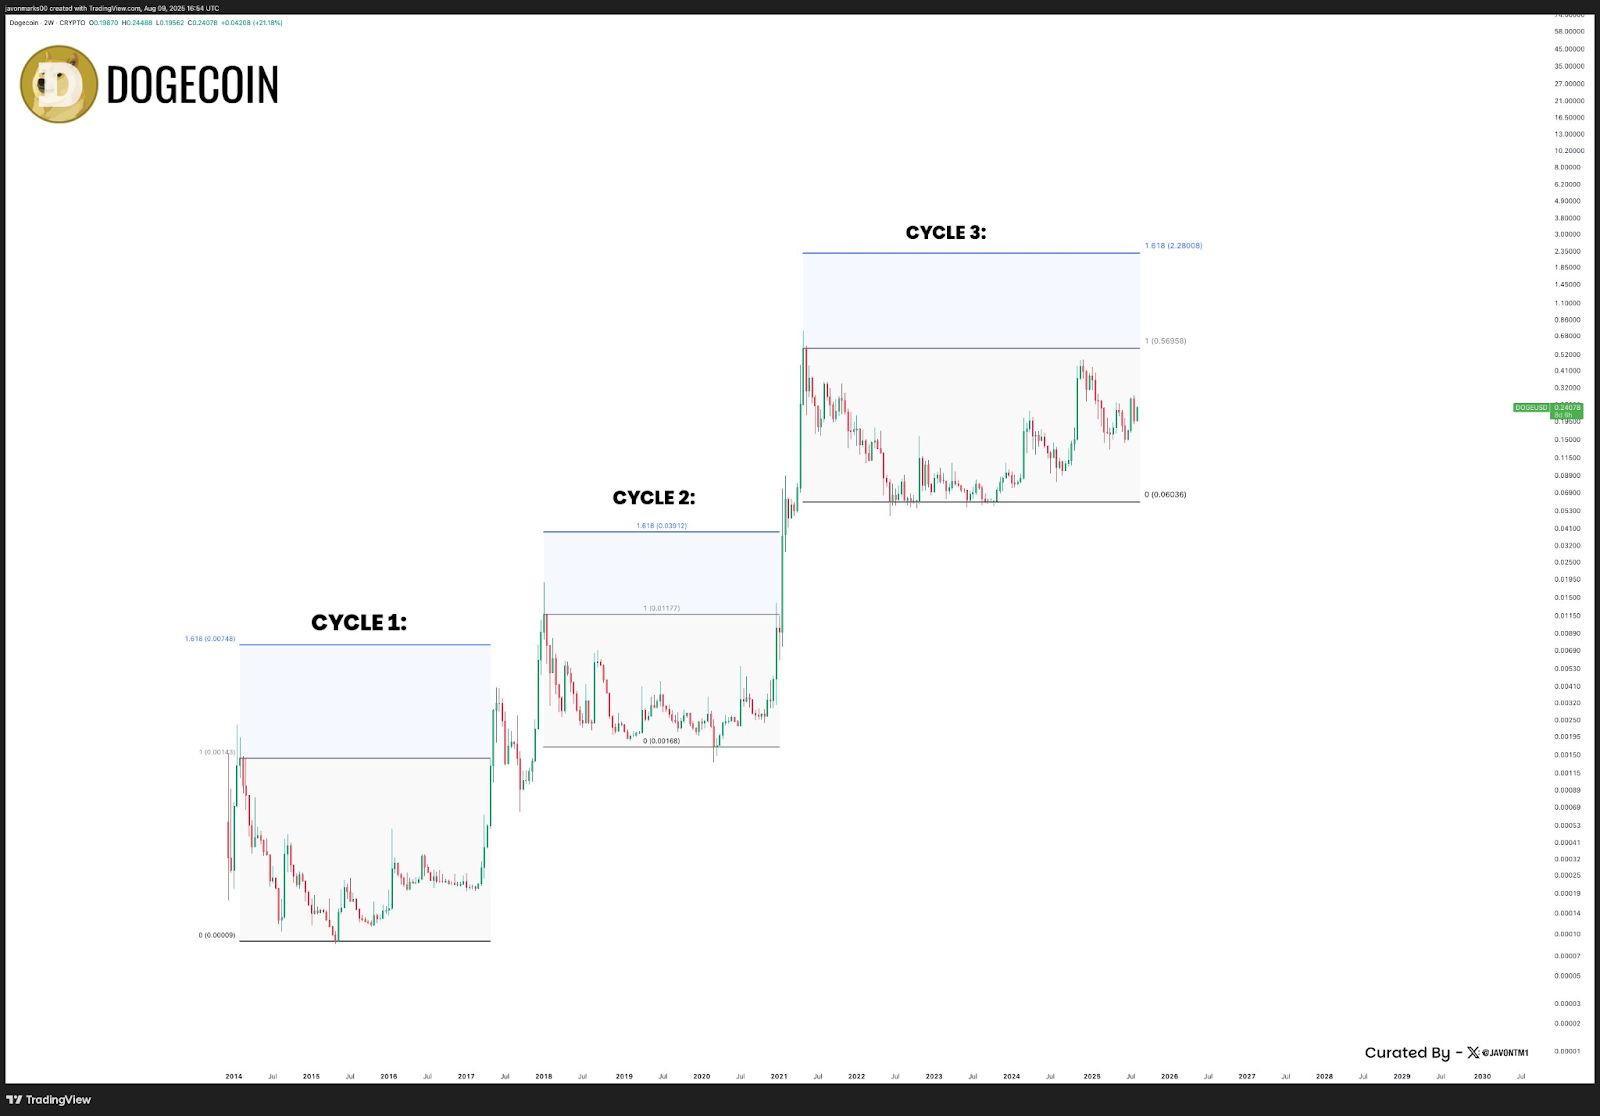 Source: Javon Marks X
DOGE now sits near the mid-point of this channel at $0.21768. Cycle analysis by Javon Marks outlines three distinct runs in DOGE history, each topping near the 1.618 Fibonacci extension of its cycle low. In Cycle 3, that level lies at $2.22806 — yet to be tested.
What Are the Current Momentum Indicators for Dogecoin?
On the 4-hour chart, DOGE’s late-July breakout from $0.18 to $0.27500 has given way to lower highs and lighter volume. MACD readings remain positive, but the gap between lines is narrowing. RSI has fallen from overbought territory at 72.68 to 64.99, signaling reduced buying pressure.
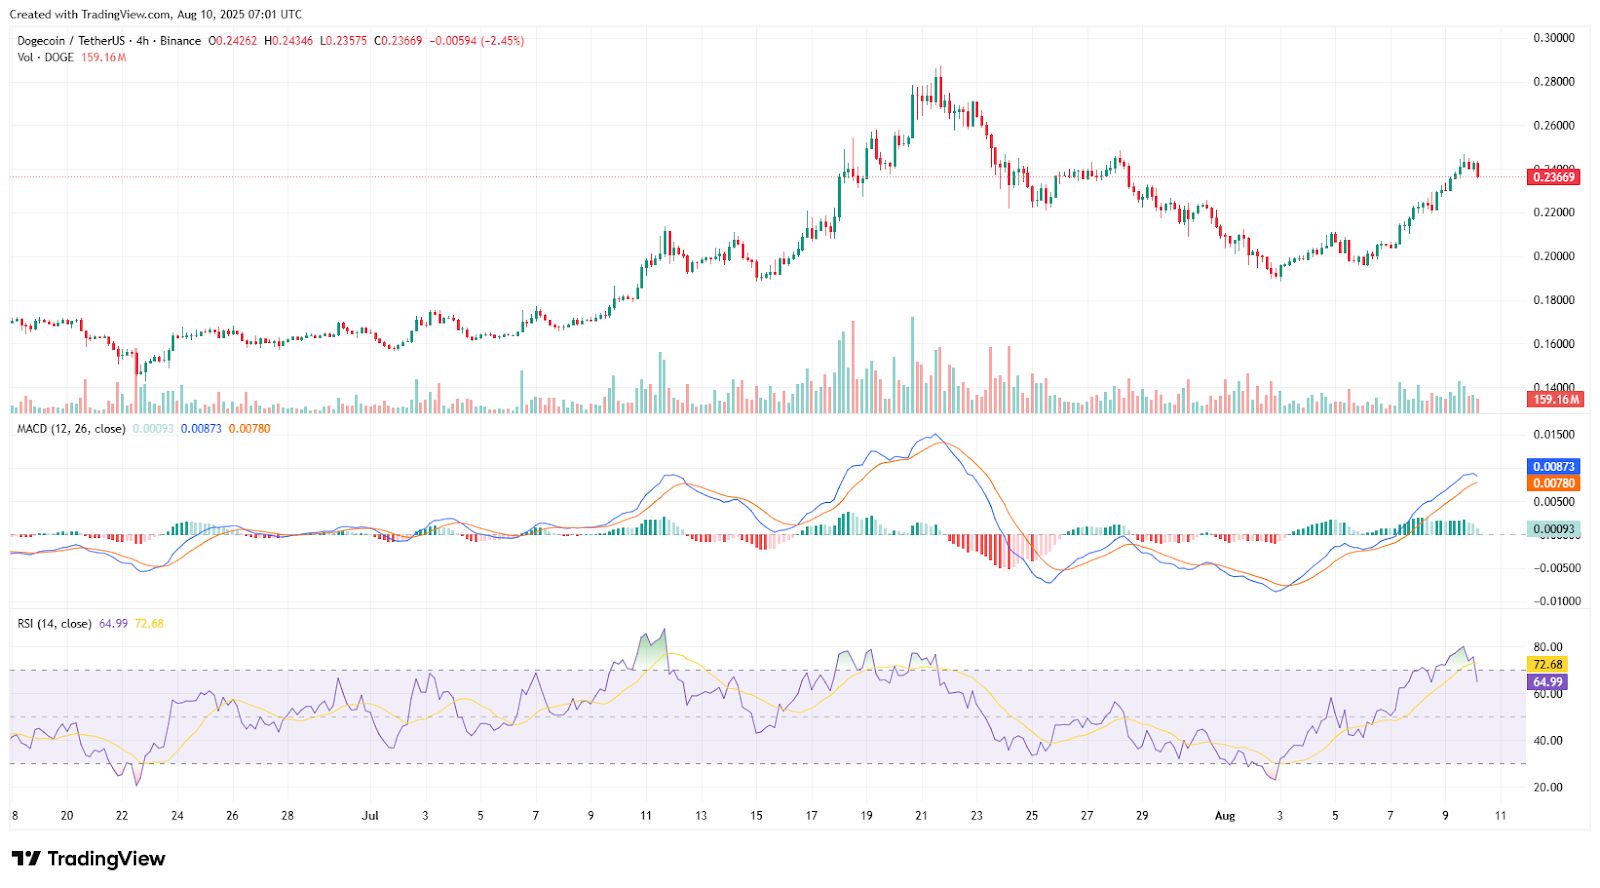 Source: Crypto Rank
DOGE/BTC data from Binance shows the pair holding a range between 0.00000180 BTC and 0.00000450 BTC since 2022. This month’s 11.60% gain to 0.00000202 BTC came with a long lower wick, reflecting demand at support.
Key Takeaways
- Resistance at $0.30: Dogecoin has faced multiple rejections at this critical level.
- Long-term Channel: The price remains within a significant ascending channel, indicating potential for future growth.
- Momentum Indicators: Current indicators suggest a cooling in buying pressure, warranting close monitoring.
Conclusion
In summary, Dogecoin’s price action is currently constrained by the $0.30 resistance while maintaining its long-term bullish structure. As momentum indicators show signs of cooling, traders should remain vigilant for potential breakout opportunities. The future trajectory of DOGE will depend on whether it can successfully breach this critical resistance level.