Bitget App
Trade smarter
Buy cryptoMarketsTradeFuturesEarnWeb3SquareMore
Trade
Spot
Buy and sell crypto with ease
Margin
Amplify your capital and maximize fund efficiency
Onchain
Going Onchain, without going Onchain!
Convert
Zero fees, no slippage
Explore
Launchhub
Gain the edge early and start winning
Copy
Copy elite trader with one click
Bots
Simple, fast, and reliable AI trading bot
Trade
USDT-M Futures
Futures settled in USDT
USDC-M Futures
Futures settled in USDC
Coin-M Futures
Futures settled in cryptocurrencies
Explore
Futures guide
A beginner-to-advanced journey in futures trading
Futures promotions
Generous rewards await
Overview
A variety of products to grow your assets
Simple Earn
Deposit and withdraw anytime to earn flexible returns with zero risk
On-chain Earn
Earn profits daily without risking principal
Structured Earn
Robust financial innovation to navigate market swings
VIP and Wealth Management
Premium services for smart wealth management
Loans
Flexible borrowing with high fund security
Manta Network (MANTA) To Rally Higher? This Emerging Fractal Setup Saying Yes!

Manta Network (MANTA) To Rally Higher? This Emerging Fractal Setup Saying Yes!

CoinsProbeCoinsProbe2025/08/15 17:10
By:Nilesh Hembade

Date: Fri, Aug 15, 2025 | 06:50 AM GMT

The cryptocurrency market is experiencing a pullback following the latest U.S. Producer Price Index (PPI) data release, which triggered a wave of sight selling pressure. Ethereum (ETH) has cooled from above $4,700 to around $4,600, weighing on major  altcoins — including Manta Network (MANTA).

MANTA is down 5% on the day, trimming its weekly gains to 4%. But beyond the day-to-day price noise, the chart is flashing a compelling bullish setup — one that strongly resembles the explosive breakout recently seen in Skale (SKL).

Manta Network (MANTA) To Rally Higher? This Emerging Fractal Setup Saying Yes! image 0 
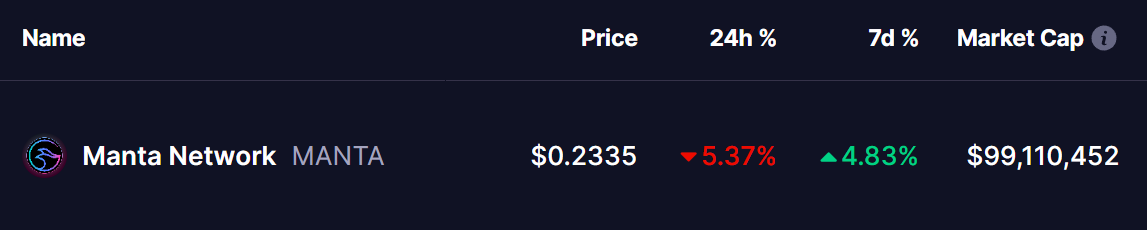
Source: Coinmarketcap

MANTA Mirrors SKL’s Breakout Structure

On SKL’s chart, a textbook falling wedge pattern — a well-known bullish reversal formation — recently played out. Once SKL broke above the wedge structure, it quickly flipped both the 200-day and 100-day moving averages into support. That technical confirmation triggered an aggressive rally of nearly 148% in just a short span.

Manta Network (MANTA) To Rally Higher? This Emerging Fractal Setup Saying Yes! image 1 
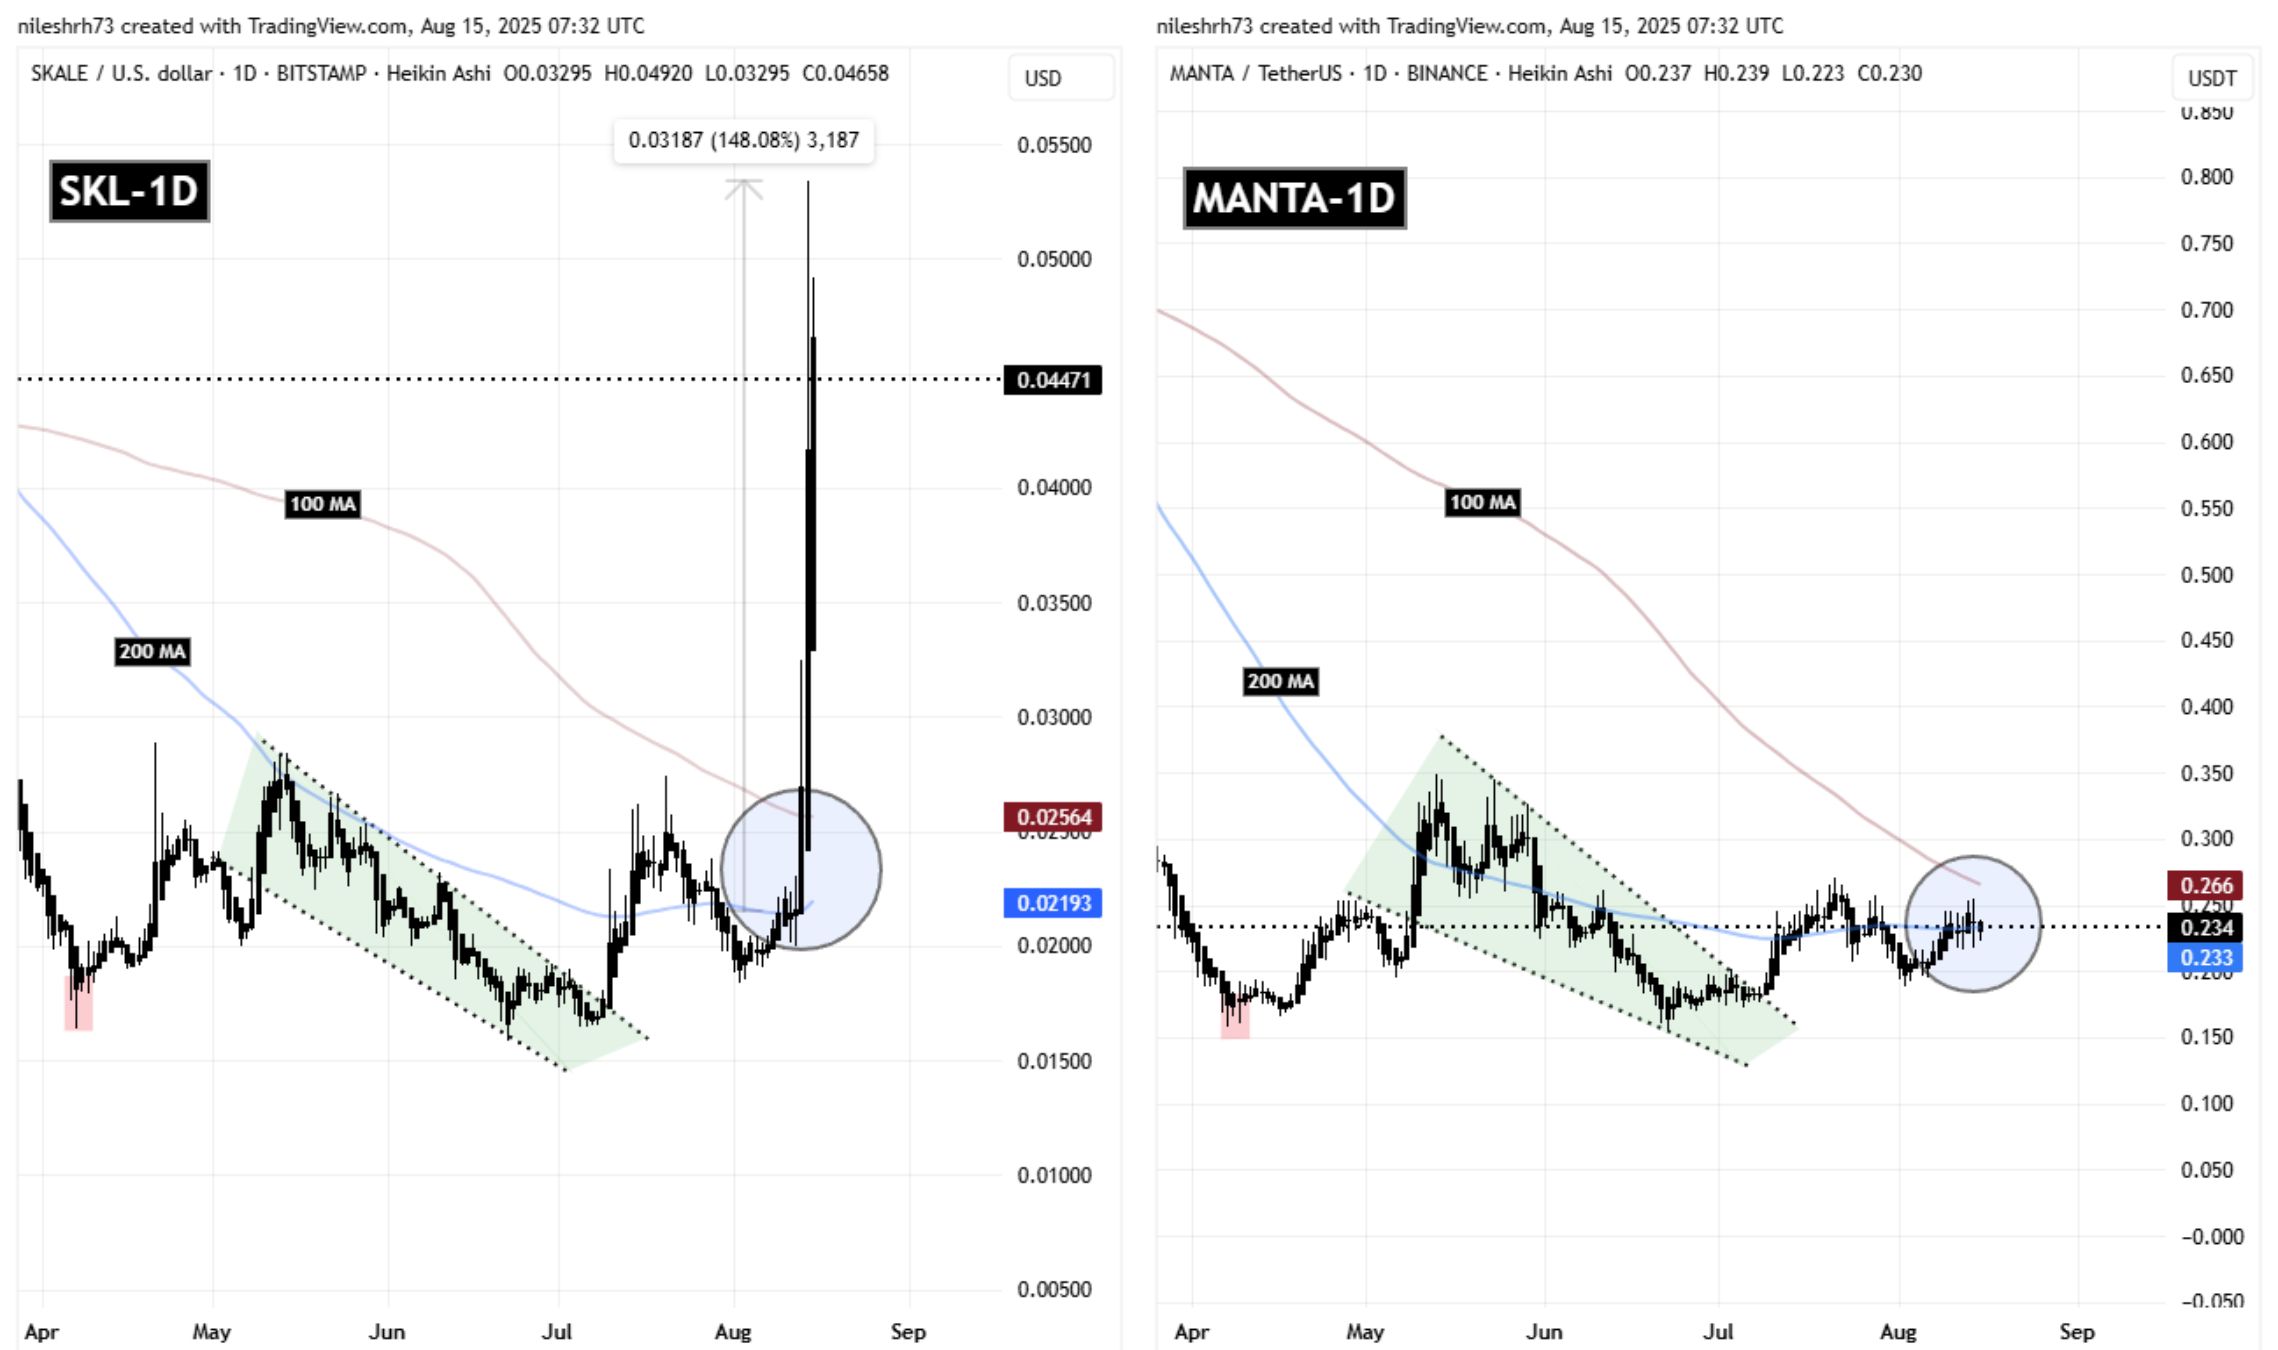
SKL and MANTA Fractal Chart/Coinsprobe (Source: Tradingview)

Now, MANTA appears to be following the same script.

Like SKL, MANTA broke out from its own falling wedge and has already printed a higher high and higher low. It is currently consolidating just below the 200-day and 100-day moving average cluster, with the 100-day MA sitting near $0.266. This kind of sideways action beneath major resistance often precedes a breakout if buying pressure builds.

What’s Next for MANTA?

To confirm the bullish fractal, MANTA must hold above the 200-day MA support near $0.233 and then break decisively above the 100-day MA at $0.266. A strong move through this zone — ideally on expanding volume — could set the stage for a measured rally toward $0.58, mirroring SKL’s 150% surge.

That said, traders should be prepared for the possibility of extended consolidation or even a false breakout if the move lacks momentum. Still, the similarity between SKL’s recent breakout and MANTA’s current structure is hard to ignore. If history repeats itself, MANTA could be gearing up for a sharp upside move.

0

Disclaimer: The content of this article solely reflects the author's opinion and does not represent the platform in any capacity. This article is not intended to serve as a reference for making investment decisions.

PoolX: Earn new token airdrops
Lock your assets and earn 10%+ APR
Lock now!

You may also like

Silver's New Dawn: Geopolitical Turmoil and Green Energy Fuel a Bull Market

- Silver faces historic transformation in 2025 due to geopolitical shocks, U.S.-China tensions, and green energy demand surge. - Mexico's production decline and Russia's BRICS-focused isolation create 206M-ounce structural deficit, the largest on record. - Solar PV (24% of industrial use) and EVs drive 50% industrial demand growth by 2030, outpacing inelastic supply from mining byproducts. - Mining equities (AGSV, VZLA) and ETPs gain traction as silver's gold-to-silver ratio (1:90) signals undervaluation a

ainvest2025/08/28 16:15
Silver's New Dawn: Geopolitical Turmoil and Green Energy Fuel a Bull Market

Gold Price: Strategic Diversification in Decentralized Decision-Making Environments

- Decentralized governance models in 2025 drive systemic risk diversification, elevating gold as a strategic hedge against geopolitical and macroeconomic volatility. - Industrial giants and emerging economies boost gold reserves, leveraging its dual role in supply chains and portfolios amid dollar erosion and sanctions. - Gold prices surge past $3,300/ounce as investors adopt 10–15% allocations, reflecting structural demand from BRICS initiatives and pension fund reforms. - Central bank gold accumulation,

ainvest2025/08/28 16:15
Gold Price: Strategic Diversification in Decentralized Decision-Making Environments

HOME +624.5% in 24 Hours Amid Sharp Short-Term Volatility

- HOME token surged 624.5% in 24 hours to $0.04023 amid sharp short-term volatility, contrasting with mixed longer-term performance. - Home Finance emphasized progress on decentralized lending protocols and governance tools to enhance cross-chain liquidity and holder control. - Analysts suggest the rally reflects temporary liquidity shifts rather than long-term reversal, with no signs of manipulation or institutional inflows. - Technical indicators show conflicting signals: overbought short-term momentum v

ainvest2025/08/28 16:13
HOME +624.5% in 24 Hours Amid Sharp Short-Term Volatility

PHB Surges 602.81% in 24 Hours Amid Market Volatility

- PHB surged 602.81% in 24 hours to $25.54, driven by social media momentum and niche ecosystem adoption. - Despite 1557.16% monthly gains, PHB faces 5420.83% annual drawdown, highlighting extreme volatility and retail-driven trading. - Technical indicators show overbought RSI and a golden cross, signaling potential $30.35 resistance test but cautioning against long-term risks. - Backtested trend-following strategies captured recent gains but incurred sharp drawdowns, emphasizing need for rapid execution a

ainvest2025/08/28 16:13
PHB Surges 602.81% in 24 Hours Amid Market Volatility