

XRP is currently consolidating between $2.90 and $3.30, with analyst Rose identifying a bullish target of $4.67 based on Fibonacci retracements and structural support levels.
-
Analyst Rose identifies $2.70–$2.50 as XRP’s ideal accumulation zone based on Fibonacci confluence and structural support.
-
RSI at 43.22 shows mild bearish bias, while MACD indicates weakening downside momentum and potential for recovery.
-
A breakout above $3.20 could drive XRP toward $3.40–$3.60, with $4.6704 set as the broader bullish target.
XRP price analysis reveals consolidation between $2.90 and $3.30, with a potential bullish target of $4.67. Stay informed on market movements!
What is XRP’s Current Price Trend?
XRP is consolidating between $2.90 and $3.30 after breaking out of a long-term descending wedge pattern. This consolidation phase is crucial for determining future price movements.
How Do Fibonacci Levels Impact XRP’s Price?
Key Fibonacci levels are critical for XRP’s next move. The 0.382 level around $2.95–$3.00 serves as strong support, while deeper levels at $2.70 and $2.46–$2.50 mark broader accumulation zones. Analyst Rose describes this as the “ideal long entry area.”
Frequently Asked Questions
What is the ideal accumulation zone for XRP?
The ideal accumulation zone for XRP is between $2.70 and $2.50, based on Fibonacci confluence and structural support.
How does the RSI affect XRP’s price?
The RSI at 43.22 indicates a mild bearish bias, suggesting potential for either direction, depending on market momentum.
Key Takeaways
- Consolidation Phase: XRP is currently consolidating between $2.90 and $3.30.
- Fibonacci Levels: Key support levels include $2.95–$3.00 and $2.70–$2.50.
- Potential Upside: A breakout above $3.20 could lead to targets of $3.40–$3.60 and $4.67.
Conclusion
XRP’s current consolidation between $2.90 and $3.30 is pivotal for its future price movements. With key Fibonacci levels acting as support, the outlook remains bullish if these zones hold. Keep an eye on market developments as XRP aims for a target of $4.67.
XRP consolidates between $2.90 and $3.30 as analyst Rose notes Fibonacci retracements and a bullish target of $4.67.
-
Analyst Rose identifies $2.70–$2.50 as XRP’s ideal accumulation zone based on Fibonacci confluence and structural support.
-
RSI at 43.22 shows mild bearish bias, while MACD shows weakening downside momentum and potential for recovery.
-
A breakout above $3.20 could drive XRP toward $3.40–$3.60, with $4.6704 set as the broader bullish target.
XRP has entered a decisive phase after breaking out of a long-term descending wedge pattern. The digital asset rallied sharply toward mid-July highs near $3.60 but is now consolidating between $2.90 and $3.30.
According to analyst Rose, the current outlook suggests a retracement toward Fibonacci support levels before another upward impulse develops. The outlook indicates both near-term caution and longer-term bullish potential if key zones hold.
Key Fibonacci Levels Define Next Move
The breakout rally has left behind key retracement levels that now act as reference points for buyers and sellers. The 0.382 level around $2.95–$3.00 is the first strong support, which could decide near-term direction.
Deeper levels, including the 0.5 retracement near $2.70 and the 0.618 area at $2.46–$2.50, mark a broader accumulation zone.
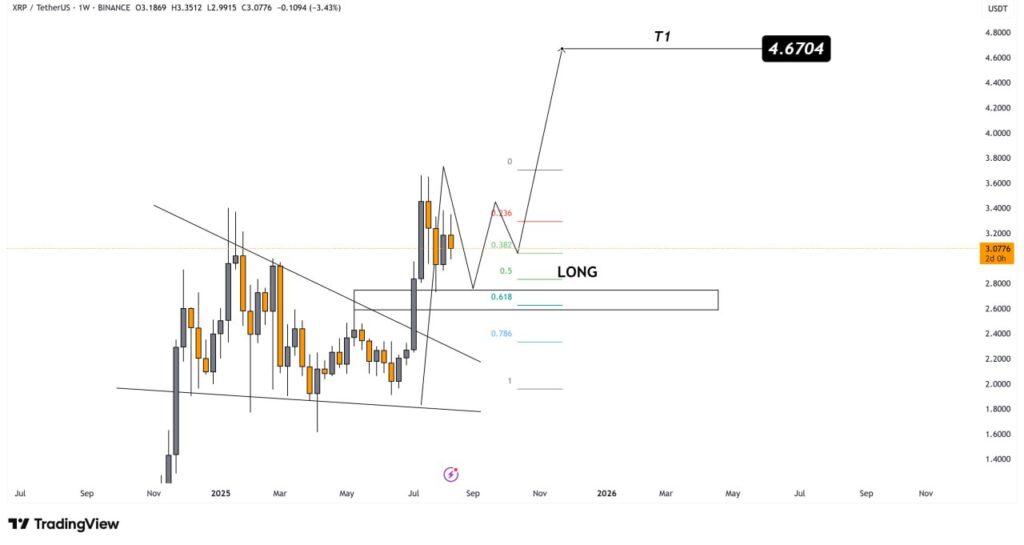 XRP/USDT 1-week price chart, Source: Rose on X
Rose noted that this region aligns with market outlook, creating what she describes as the “ideal long entry area.” Below these levels, the 0.786 retracement near $2.07 provides an additional downside marker for longer-term positioning.
Technical Indicators Show Mixed Conditions
Momentum indicators provide clarity on XRP’s consolidation. The RSI is at 43.22, below the neutral 50 level. This indicates mild bearish bias, though not yet oversold, with potential for either direction.
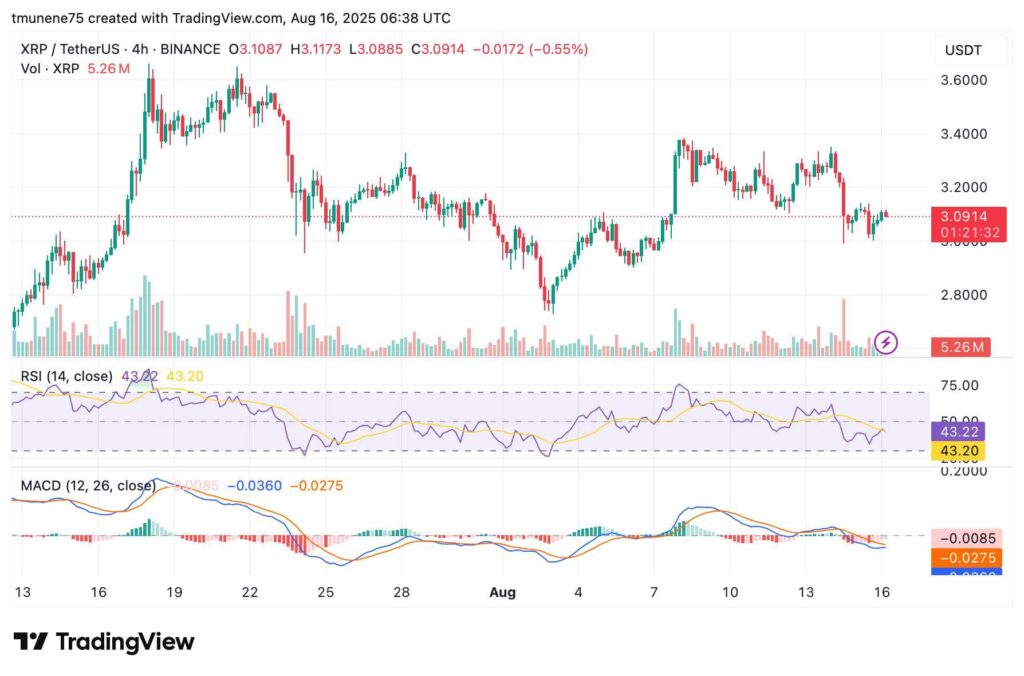 XRP/USDT 4-hour price chart, Source: TradingView
A drop below 40 could strengthen selling momentum, while a recovery above 50 would favor buyers again. Meanwhile, the MACD line at -0.0085 and signal line at -0.0275 show weakening downward pressure.
The histogram shows diminishing bearish momentum, suggesting a possible change if buying activity increases. Volume is at 5.26 million, notably subdued compared with earlier peaks, indicating the lack of strong conviction at present.
XRP Possible Price Scenarios
A break above the $3.20 resistance could trigger momentum toward the $3.40–$3.60 region. This move would align with improving RSI levels and a possible MACD crossover.
However, rejection at resistance followed by a drop below $2.90 support may extend losses toward $2.70. Rose projects that if the retracement zones hold, XRP could resume its broader bullish trend with an upside target at $4.67.