Bollinger Bands Indicate XRP Trend Shift

Could XRP initiate a decisive turning point ? A rarely observed technical signal attracts analysts’ attention : Bollinger Bands draw a setup favorable to a trend reversal. While the market remains volatile and volumes decline, the asset shows signs of resilience above a critical threshold. Enough to revive the interest of seasoned investors, on the lookout for a strategic entry point. Is this movement the prelude to a new bullish cycle or just a simple technical rebound ?
In Brief
- XRP sends an unexpected technical signal via the Bollinger Bands, indicating a possible trend reversal.
- The asset precisely rebounds on the middle band at $3.10, considered a key short-term support.
- The upper band ($3.37) and lower band ($2.84) define levels to watch in the coming days.
- The $3.50 zone remains the major technical resistance to overcome to target a return towards $4.
An Unexpected Technical Signal Emerges
While institutional investors are returning to XRP , among the most closely watched technical indicators currently, Bollinger Bands send a clear signal : “a trend reversal could be looming for XRP”.
Currently, the asset is trading at $3.13, up +0.76 % over 24 hours, after reaching a daily peak of $3.16. This rebound occurred precisely at the middle band level, located at $3.10, a level interpreted as key support.
The technical indicator thus draws a setup in which a bullish recovery remains possible as long as the price holds above this middle line. The other two reference levels, $3.37 for the upper band and $2.84 for the lower band, frame this dynamic, defining the asset’s current maneuvering room.
The current technical context can be summarized by several concrete elements :
- The current price : $3.13, a slight rise over 24 hours ;
- The rebound level : $3.10, corresponding to the Bollinger middle band, considered decisive support ;
- The upper band : $3.37, identified as the next resistance to overcome ;
- The lower band : $2.84, a support level in case of bearish reversal ;
- The trading volume : sharply down, with a decrease of -31.97%, at 6.6 billion dollars ;
- The main chart signal : XRP holding above its median support, opening the way for a possible push towards the upper band, provided volumes return.
These on-chain data reflect a fragile yet constructive technical configuration, where the price seems ready to move upwards… provided a renewed participation in the crypto market. The next major test will likely be the $3.37 zone, whose breach could set the tone going forward.
Confidence is Built Among Major Investors
Another signal, much more discreet but potentially decisive, deserves special attention: the entry of a whale. Indeed, an unidentified crypto player reportedly acquired 120 million XRP.
This massive move indicates renewed confidence in the asset’s rebound potential. Such positioning, rarely motivated by a mere fashion trend, often signals a thoughtful medium- to long-term strategy.
Thus, this accumulation operation occurs at a critical moment, as XRP attempts to stabilize above the $3.10 zone. If it manages to sustainably break the $3.50 resistance, a level identified as a major technical hurdle, the asset could target a return towards $4, provided the overall crypto market remains favorable.
This level has not been reached for several weeks, and its break could potentially open the way to a market structure change.
It is then necessary to determine whether this developing momentum will be confirmed by an influx of sufficient volume to validate a sustained bullish breakout. The entry of an institutional player certainly reshuffles the cards. It reflects a more strategic reading of the crypto market, where some see beyond immediate fluctuations. If technical signals converge with a tangible recovery in the derivatives or spot market, the scenario of XRP targeting $4 ceases to be speculative and becomes a credible hypothesis.
Disclaimer: The content of this article solely reflects the author's opinion and does not represent the platform in any capacity. This article is not intended to serve as a reference for making investment decisions.
You may also like
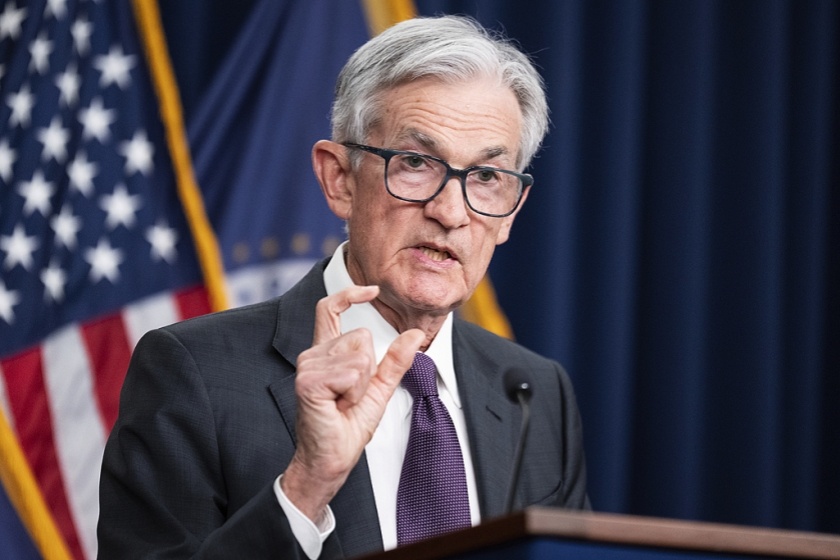
Wall Street interprets the Federal Reserve decision as more dovish than expected
The market originally expected a "hawkish rate cut" from the Federal Reserve, but in reality, there were no additional dissenters, no higher dot plot, and the anticipated tough stance from Powell did not materialize.
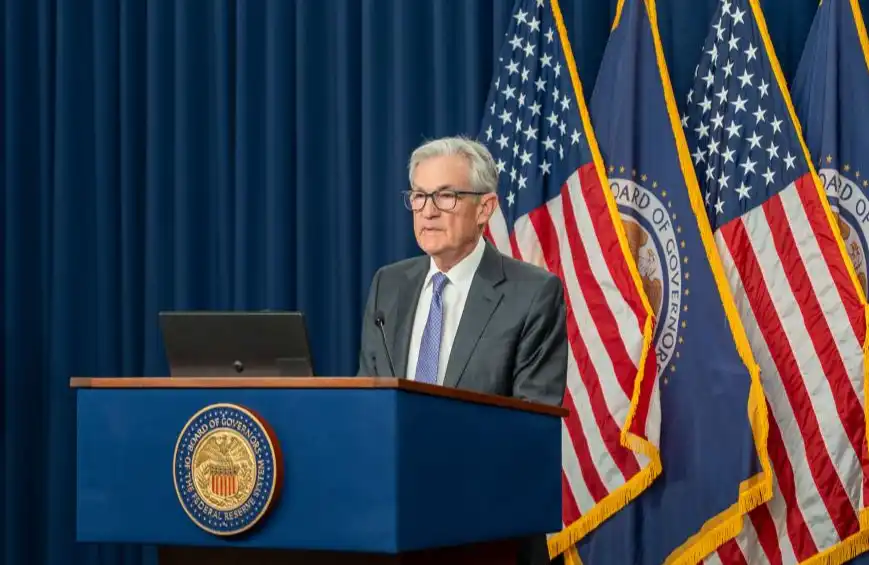
The Federal Reserve cuts rates again but divisions deepen, next year's path may become more conservative
Although this rate cut was as expected, there was an unusual split within the Federal Reserve, and it hinted at a possible prolonged pause in the future. At the same time, the Fed is stabilizing year-end liquidity by purchasing short-term bonds.
Betting on LUNA: $1.8 billion is being wagered on Do Kwon's prison sentence
The surge in LUNA’s price and huge trading volume are not a result of fundamental recovery, but rather the market betting with real money on how long Do Kwon will be sentenced on the eve of his sentencing.

What is the overseas crypto community talking about today?
What have foreigners been most concerned about in the past 24 hours?