
HBAR Price Risks Breakdown as Hedera Network Activity Plunges

HBAR’s price struggles due to declining user activity, with falling TVL and a 60% drop in DEX volumes adding to the bearish sentiment. If this trend continues, HBAR could break below $0.227, potentially falling to $0.196.
Since July 17, Hedera Hashgraph’s native token, HBAR, has trended mostly sideways. Despite several attempts at an upward breakout, market volatility and growing bearish sentiment have repeatedly prevented this.
Now, with Hedera showing signs of weakening user demand, HBAR risks extended consolidation or even deeper losses.
Falling TVL and DEX Volumes Put HBAR’s Price Stability at Risk
Over the past few days, user activity on the Hedera network has declined, marked by a drop in its total value locked (TVL). Per Artemis data, this currently sits at $129 million, down 5% since August 14.
For token TA and market updates: Want more token insights like this? Sign up for Editor Harsh Notariya’s Daily Crypto Newsletter here.
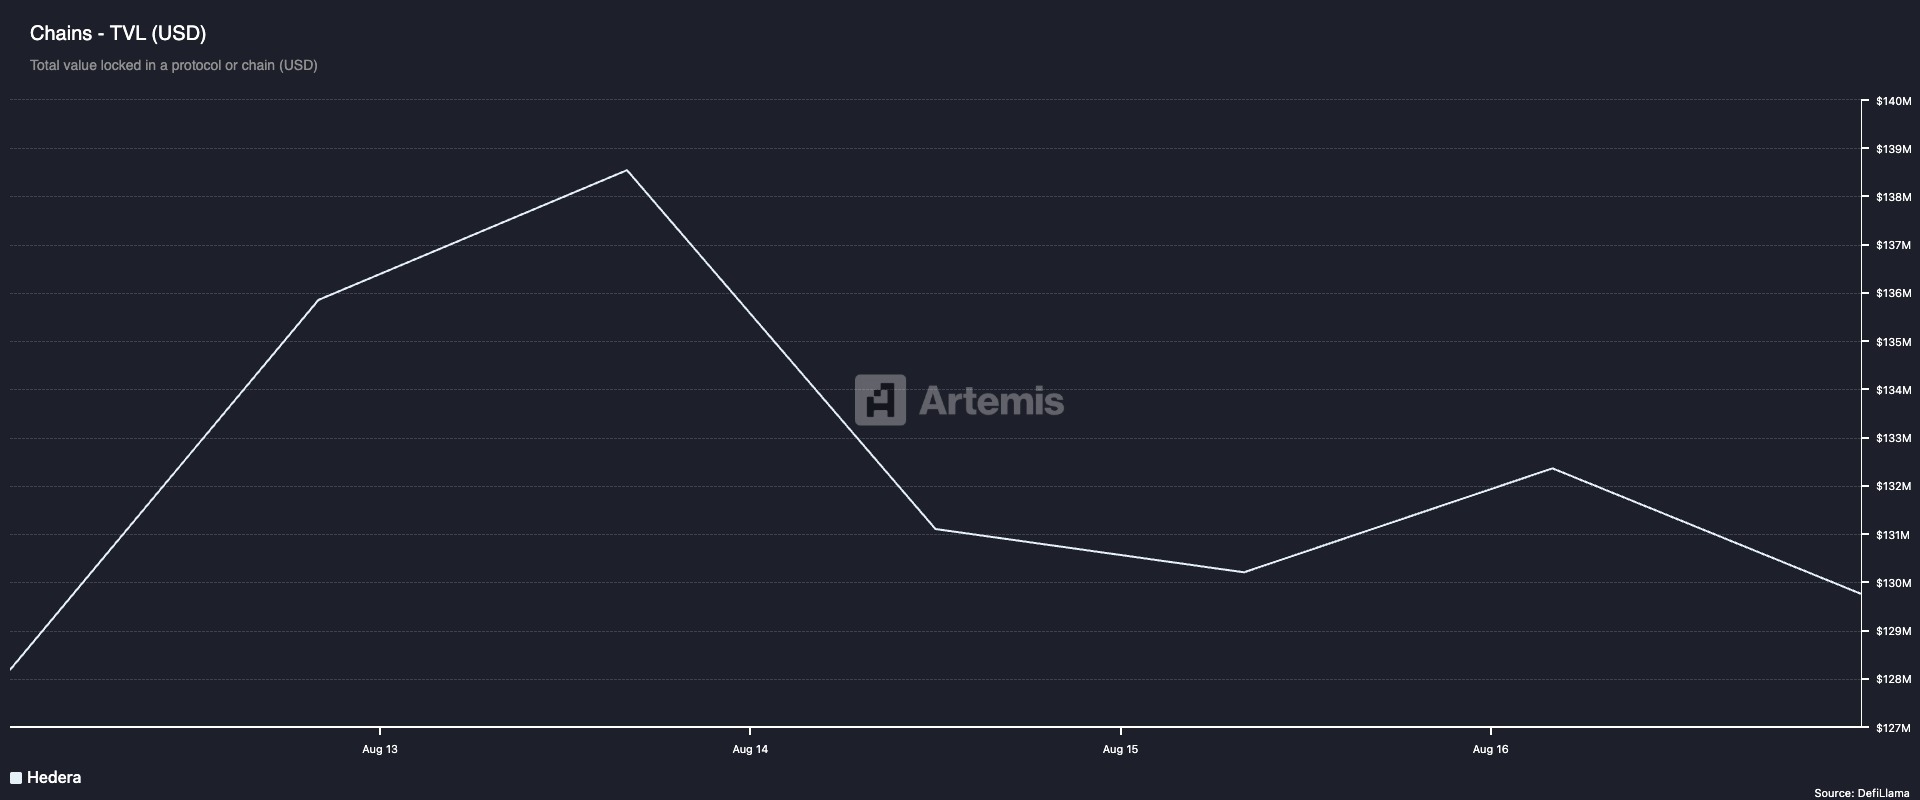 Hedera TVL. Source:
Artemis
Hedera TVL. Source:
Artemis
TVL measures the total capital deposited across a network’s decentralized finance (DeFi) protocols, making it a key gauge of investor confidence and user demand. A rising TVL reflects increasing activity and demand, as more users lock assets into lending, staking, or liquidity pools.
Conversely, a falling TVL signals declining participation, reduced liquidity, and waning confidence. Therefore, Hedera’s falling TVL suggests a dip in users engaging with its DeFi ecosystem, adding pressure to HBAR’s already stagnant price action.
Further, the fall in decentralized exchange (DEX) volumes on Hedera confirms the plummeting user activity on the network. In the past week, this has dropped by nearly 60%, according to Artemis.
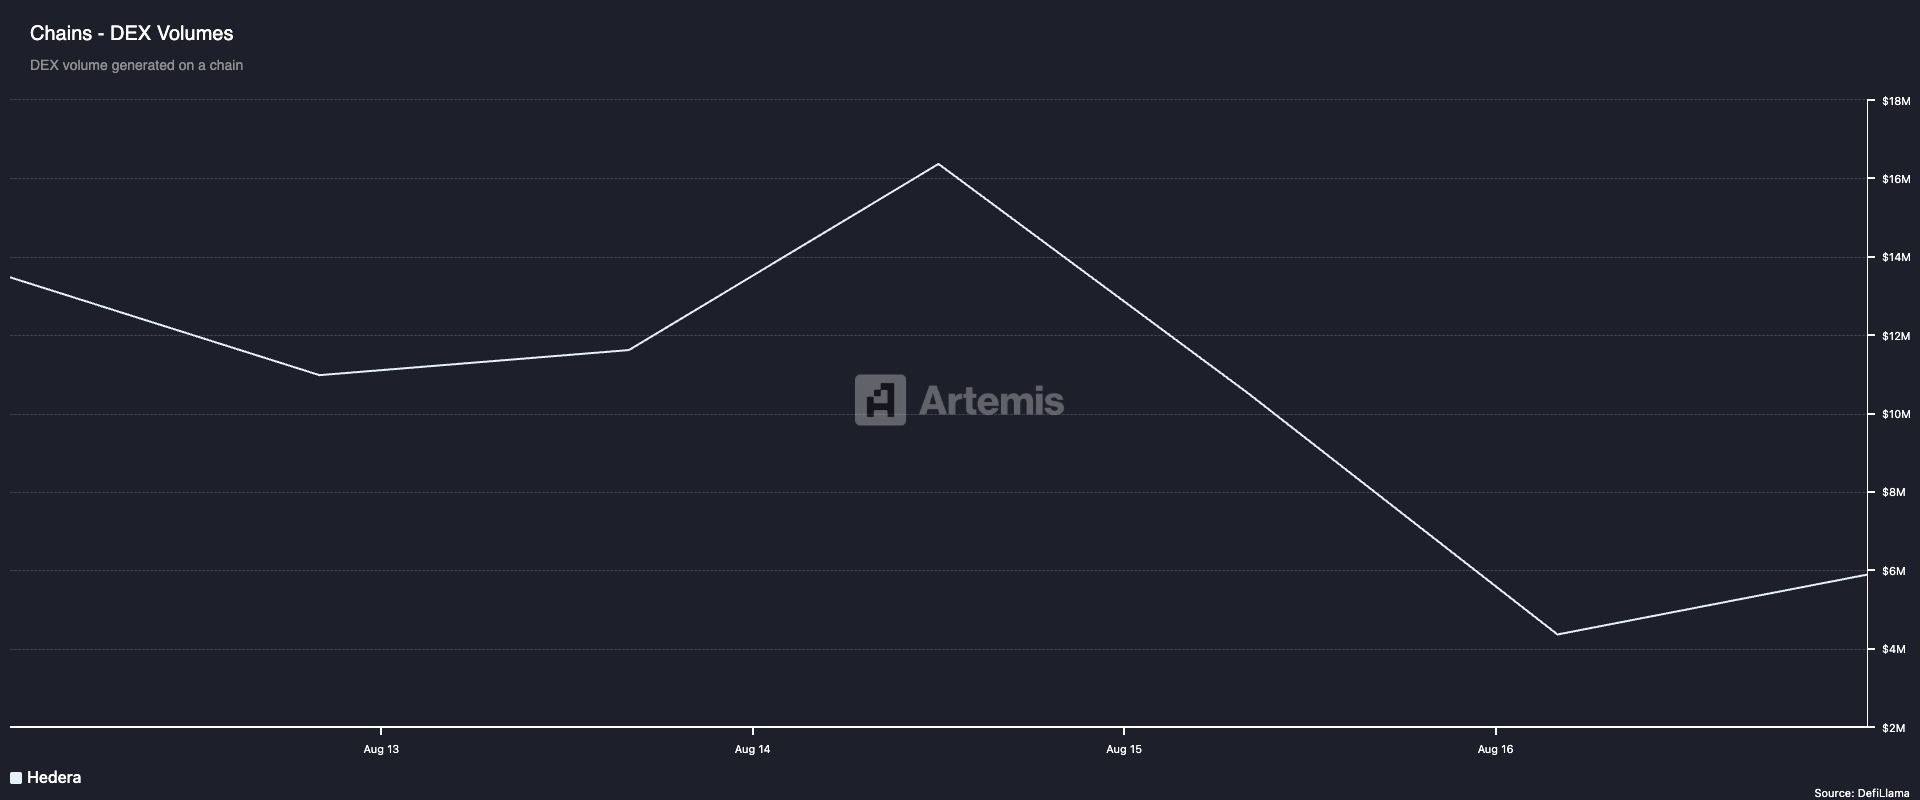 Hedera DEX Volume. Source:
Artemis
Hedera DEX Volume. Source:
Artemis
A decline in DEX volume reflects weakening transaction flow, with fewer users swapping, trading, or providing liquidity across the network’s protocols.
This reduction in trading momentum limits Hedera’s on-chain activity and highlights reduced speculative interest in its native token. It dampens short-term price recovery hopes and increases the risk of extended stagnation or a bearish breakdown if demand remains absent.
Can HBAR Hold $0.227?
On the daily chart, readings from HBAR’s Moving Average Convergence Divergence (MACD) confirm the possibility of a bearish breakout of its current range.
At press time, HBAR’s MACD line (blue) rests below the signal line (orange), a sign that sell-side pressure is gaining dominance.
The MACD indicator identifies trends and momentum in its price movement. It helps traders spot potential buy or sell signals through crossovers between the MACD and signal lines.
When the MACD line rests below the signal line, it indicates declining buying pressure and growing selloffs. If this continues, it could trigger a breach of the support formed at $0.227. A break below this key support could lead to a deeper drop toward $0.196.
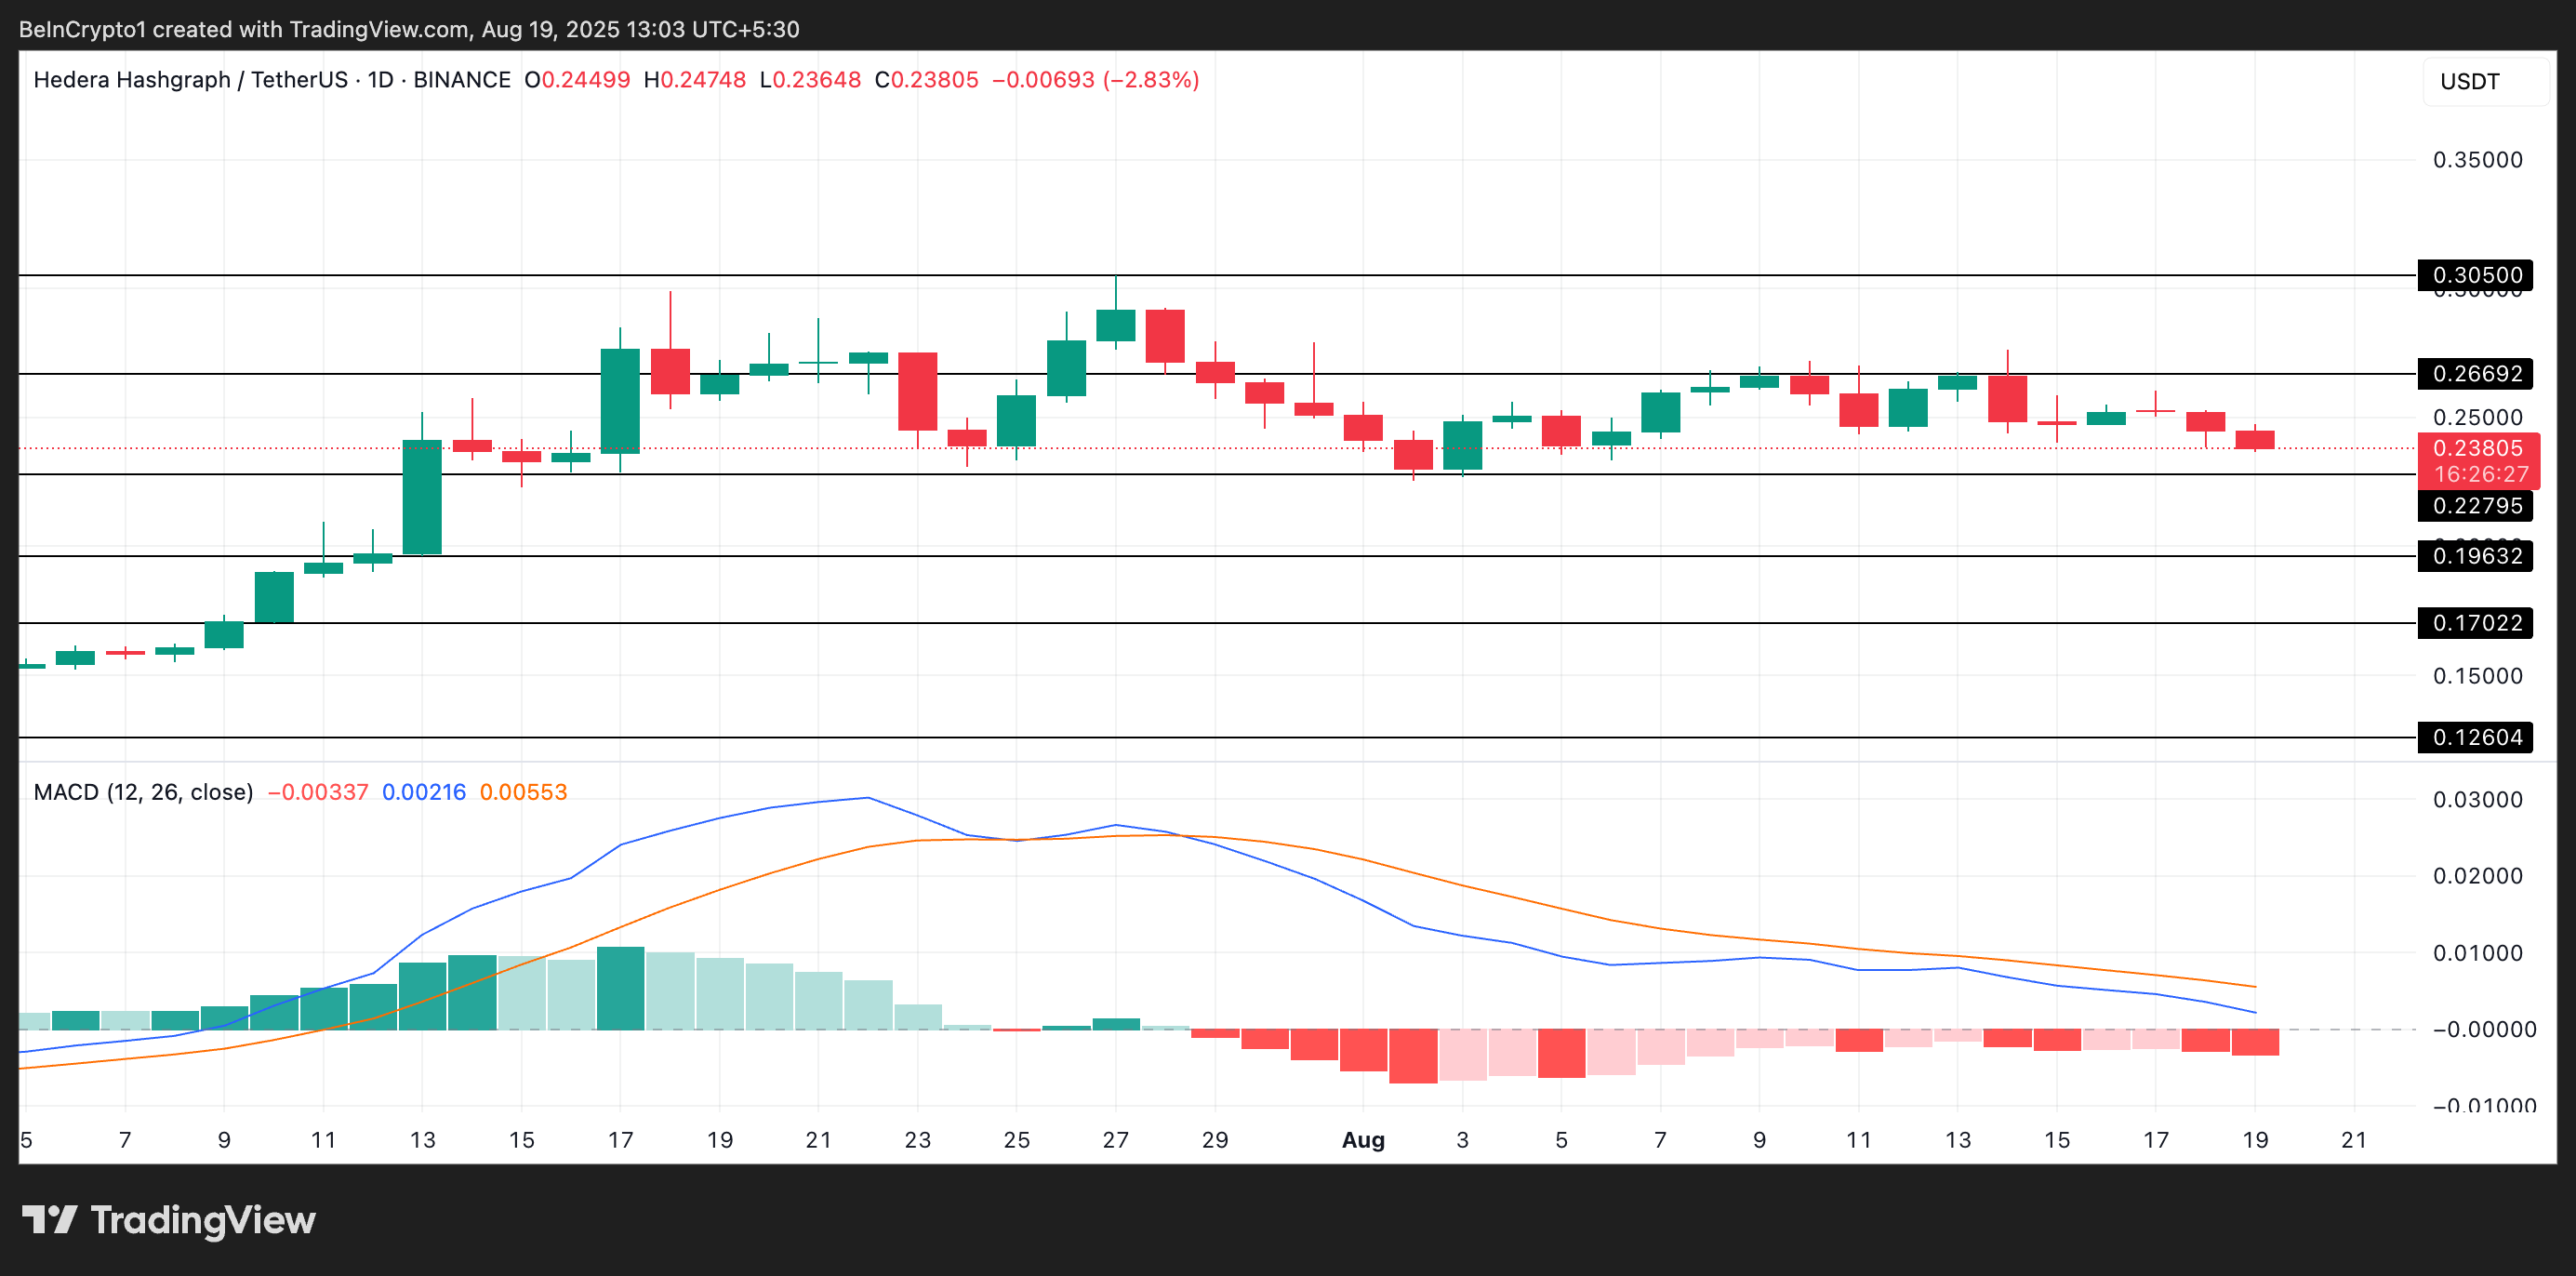 HBAR Price Analysis. Source:
TradingView
HBAR Price Analysis. Source:
TradingView
However, HBAR’s price could break above $0.266 if sentiment improves and buying resumes.
Disclaimer: The content of this article solely reflects the author's opinion and does not represent the platform in any capacity. This article is not intended to serve as a reference for making investment decisions.
You may also like
2025 TGE Survival Ranking: Who Will Rise to the Top and Who Will Fall? Complete Grading of 30+ New Tokens, AVICI Dominates S+
The article analyzes the TGE performance of multiple blockchain projects, evaluating project performance using three dimensions: current price versus all-time high, time span, and liquidity-to-market cap ratio. Projects are then categorized into five grades: S, A, B, C, and D. Summary generated by Mars AI This summary was generated by the Mars AI model, and the accuracy and completeness of its content are still being iteratively updated.

Mars Finance | "Machi" increases long positions, profits exceed 10 million dollars, whale shorts 1,000 BTC
Russian households have invested 3.7 billion rubles in cryptocurrency derivatives, mainly dominated by a few large players. INTERPOL has listed cryptocurrency fraud as a global threat. Malicious Chrome extensions are stealing Solana funds. The UK has proposed new tax regulations for DeFi. Bitcoin surpasses $91,000. Summary generated by Mars AI. The accuracy and completeness of this summary are still being iteratively updated by the Mars AI model.

How much is ETH really worth? Hashed provides 10 different valuation methods in one go
After taking a weighted average, the fair price of ETH exceeds $4,700.

Dragonfly partner: Crypto has fallen into financial cynicism, and those valuing public blockchains with PE ratios have already lost
People tend to overestimate what can happen in two years, but underestimate what can happen in ten years.
