Date: Wed, Aug 20, 2025 | 05:24 AM GMT
The cryptocurrency market is experiencing notable selling pressure as Ethereum (ETH) slips to $4,150 from its recent high of $4,780, marking a 10% drop over the week. This decline has spilled over into major altcoins , including Sui (SUI).
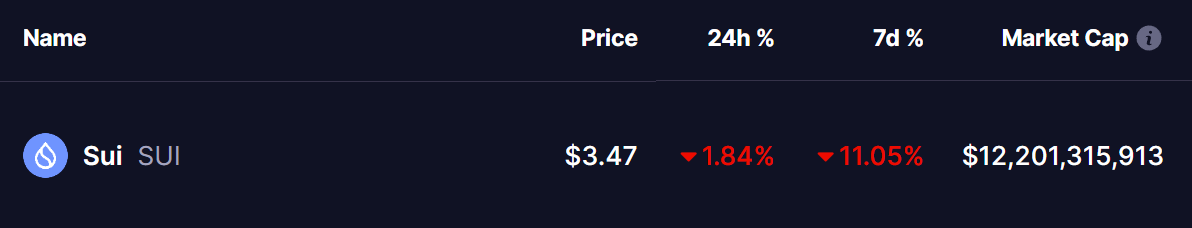
SUI is in the red today with a 10% weekly drop, and its current chart structure reveals a familiar price behavior, which may offer clues about what’s next.
 Source: Coinmarketcap
Familiar Pattern Hints at Potential Pullback
On the daily timeframe, SUI has been moving inside a broad rising wedge pattern — a structure often associated with slowing bullish momentum and looming reversals.
The chart shows a repeating pattern. In the last cycle, SUI rallied after a bullish crossover (blue circle) but stalled at the wedge’s top. It then broke below the 25-day MA and fell toward the 100-day MA (green circle). After a brief hold, the rebound failed (red circle), leading to a sharp 22% breakdown from the 100-day MA (yellow circle) to the wedge’s lower trendline.
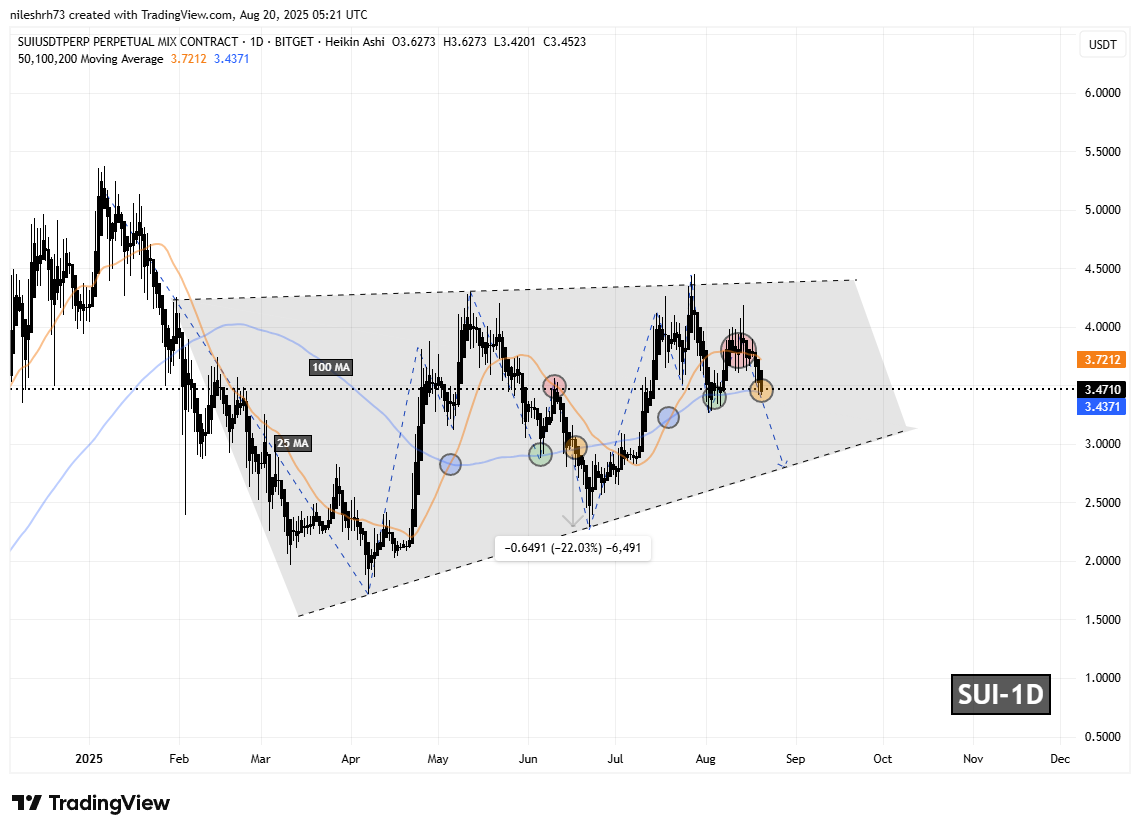 Sui (SUI) Daily Chart/Coinsprobe (Source: Tradingview)
Now, history seems to be rhyming.
SUI has once again failed to hold its 25-day MA, marked in the red circle, which pushed its price down to test the 100-day MA at $3.43. It is currently trading slightly above it at $3.47, hovering just above this crucial level. This setup closely mirrors the conditions that preceded the previous steep decline.
What’s Next for SUI?
If the 100-day MA at $3.43 fails to hold, it would validate the emerging bearish fractal and likely trigger another leg down. The next major support sits near the wedge’s lower boundary around $2.80, implying a potential 19% downside from current levels.
On the other hand, if buyers manage to defend and reclaim the 25-day MA ($3.72) in the coming days, the bearish thesis would weaken. In such a case, SUI could mount another push toward the wedge’s upper resistance, allowing the broader uptrend structure to remain intact.