Bitcoin Slides Below $113K, Key Signals Hint at Next Move

- Bitcoin slips under $113K, sparking fear but hinting at potential buyer accumulation zones.
- Market sentiment flips bearish, yet history shows extreme fear often precedes strong rebounds.
- Descending channel signals possible consolidation, manipulation, or distribution by large holders.
Bitcoin’s (BTC) price recently dropped below $113,000, marking a significant shift in retail trader sentiment across the crypto market. Social media sentiment has turned highly negative, reflecting the most bearish outlook since June’s geopolitical tensions triggered broad selloffs. This reversal in mood follows BTC’s failure to sustain its earlier momentum and maintain key support levels above $115,000. The dramatic sentiment shift underscores the volatility plaguing retail expectations in today’s uncertain trading environment.
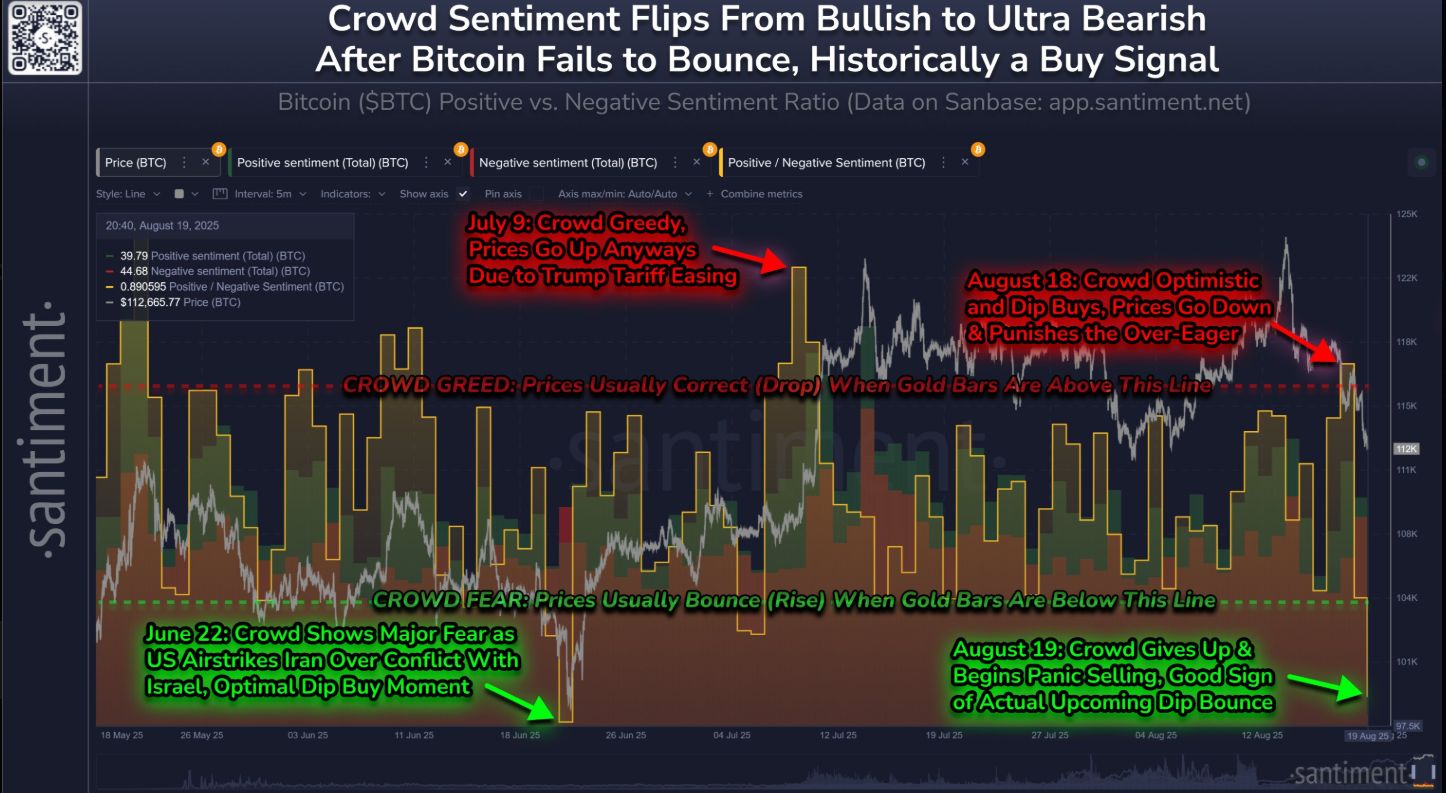
Data from sentiment analysis platforms confirms that crowd emotions moved from extreme greed to peak fear within just a 24-hour window. This reaction is consistent with past market cycles, where pessimism tends to precede significant rebounds in Bitcoin’s valuation.

Source: X
Traders should be cautious not to overreact to short-term emotional shifts that often misrepresent longer-term technical signals. Understanding this psychological cycle is essential for interpreting potential price action in Bitcoin’s current range.
Chart Behavior Suggests Three Probable Market States
Bitcoin is now trading within a clean downtrending channel, and price action is increasingly narrowing with volatility gradually decreasing. This trend normally represents either one of the three types of market action, which are price consolidation, trader manipulation, or distribution by a large holder. Both situations have their implications on market direction, and their success can only be observed thoroughly with technical indicators and volume tracking instruments.
Consolidation occurs when prices move sideways within a defined channel, often preceding a breakout or breakdown based on volume surges. Manipulation is typically indicated by sharp wicks in either direction that trigger stop-losses, often without sustained follow-through. Distribution involves large holders gradually offloading their positions during deceptive stability phases, leading to delayed but strong downward moves.
While prices remain in this descending range, volatility compression may lead to explosive movement once a breakout level is breached. An up-move breaking above the upper resistance channel with a high volume may indicate a bullish reversal process. On the other hand, violation of the lower channel support around $110,000 could imply the start of a larger correction. The monitor of momentum oscillators should be used in order to confirm momentum watchers, so as not to have false breakouts.
Historical Sentiment Cycles and Charting Implications
Santiment’s sentiment data shows crowd behavior has historically opposed subsequent price action, making fear-based dips attractive to long-term investors. On June 22, extreme fear coincided with U.S.military action, which led to panic selling, followed by a sudden rise in the price of BTC. The same behavioural pattern was also recorded on July 9 and Aug. 18, where optimism rose prematurely, resulting in an overbought condition and sharp corrections.
The historical cycles reveal the accuracy of aligning the data on the crowd sentiment with the technical charting instruments to enter the best-positioned areas. For instance, if teh price decreases or negative sentiment but stable volume, it can be an accumulation measure and not a general liquidation. Traders can overlay the Relative Strength Index (RSI) and the Directional Movement Index (DMI) to gauge trend strength and signal changes in momentum direction.
Currently, Bitcoin’s position near levels last seen during the US-Iran-Israel conflict hints at potential accumulation zones. However, there is no confirmation of a bullish reversal until technical resistance near $117,000 is broken with strong support. Any premature long positions without confluence of volume and sentiment indicators could expose traders to further downside risks.
Related: Bitcoin Breaks $124K Amid Rate Cut, CPI, and Political Pressures
Technical Signals and Forward Outlook
A mixed yet optimistic picture is presented by the technical indicators, suggesting that the market may be at a potential inflection point regarding Bitcoin, and the Directional Movement Index (DMI) displayed indications of a bearish crossover. However, its ADX line is getting flat, signifying a weak trend. In case the DMI turns back to a bullish crossover, this would be a positive sign that the upward momentum will resume among the market players.
In the meantime, the Supertrend indicator is still in support mode, meaning that buyers have not yet forfeited the trade completely. This metric, dependent on the average true range, has been consistent as it holds onto previous declines to act as a launching pad to price rebound. If BTC remains trading above $110,000, the commodity runners will likely recapture the 117,000 block as the immediate resistance. Closes above this level on a sustained basis would further open the possibilities of challenging the all-time high, almost at the level of 125,000.
The post Bitcoin Slides Below $113K, Key Signals Hint at Next Move appeared first on Cryptotale.
Disclaimer: The content of this article solely reflects the author's opinion and does not represent the platform in any capacity. This article is not intended to serve as a reference for making investment decisions.
You may also like
Crypto Markets Face a Rollercoaster: What Happened in the Past 24 Hours?
In Brief Bitcoin price dropped by 2.4%, influencing overall crypto market sentiment. The top 10 cryptocurrencies saw a general decline over the past 24 hours. Market seeks stability amid cautious investor behavior and potential short-term volatility.

