Key Notes
- BNB reached a record $882 before consolidating near $851.
- Analysts suggest $1,000 could be within reach soon.
- Treasury allocations and ETF hopes fuel bullish sentiment.
BNB BNB $842.0 24h volatility: 0.6% Market cap: $117.30 B Vol. 24h: $2.44 B has achieved a new all-time high of $882, surpassing its previous record of $864 set just last week.
At the time of writing, the token trades around $851, reflecting a 3% daily gain.
The milestone sparked excitement among market watchers and investors.BNB has recorded a 20% spike in its 24-hour trading volume, currently standing at $3.51 billion.
Popular analyst Bitbull noted that BNB flipped a multi-year resistance level of $750 into strong support, stating $1,000 BNB is “just a matter of time.”
$BNB hit a new ATH of $880 today.
It has now flipped its multi-year resistance level into support.
With public-listed companies bidding BNB, $1K BNB is just a matter of time. https://t.co/GM9YD7OZVD pic.twitter.com/8dgAZmxTQr
— BitBull (@AkaBull_) August 21, 2025
The last time such a major shift happened was in 2021 when BNB surged by over five times within just 15 days.
Growing Institutional Interest and ETF Speculation
BNB has recently recorded a significant increase in institutional interest. Nasdaq-listed BNC, the largest corporate BNB treasury holder globally, plans to accumulate 1% of the total token supply by 2025-end.
Windtree Therapeutics, another publicly traded firm, secured $60 million worth of BNB in July.
The ongoing ETF filings are further fueling bullish BNB price optimism. If the SEC approves BNB ETF applications, analysts expect an influx of massive institutional capital.
HashGlobal projected BNB could reach $2,000 before year-end, with ETF approval acting as a key catalyst.
Meanwhile, BNB’s growing utility in DeFi and exchange operations also support bullish momentum.
BNB Price to $1K Soon?
On the daily BNB price chart, the RSI is suggesting the cryptocurrency is in bullish territory but not yet overbought. However, a further push in RSI could signal overheating, with $750 acting as a strong support level.
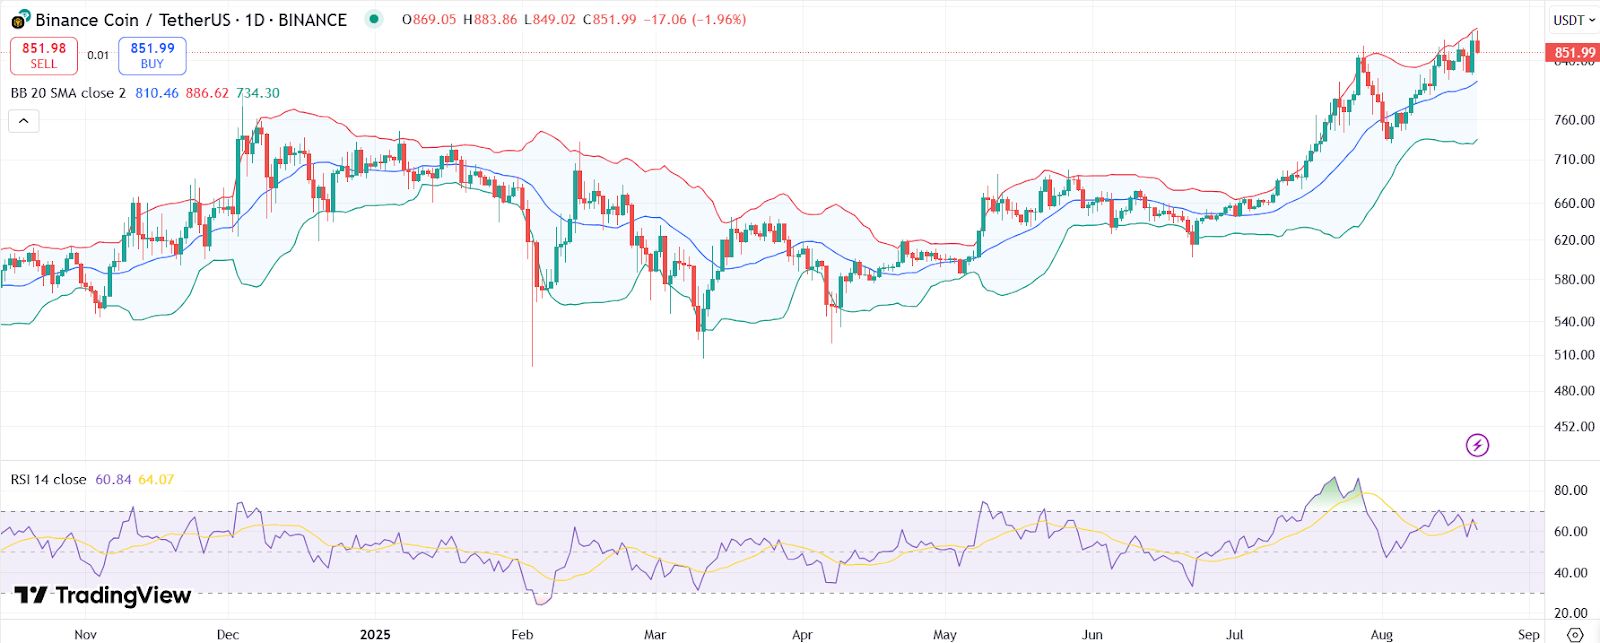
BNB price chart with RSI and Bollinger Bands. | Source: Trading View
The price is hugging the upper Bollinger Band near $882, reflecting strong upward pressure. If BNB manages to sustainably close above the peak, traders could see a rally to $920 and even to $1,000.
However, the bands also hint at possible short-term overextension, with immediate support seen at the mid-band (20-day SMA) around $810.
The MACD remains in positive territory, with the MACD line above the signal line.
However, the narrowing histogram bars suggest momentum may be slowing, leaving room for consolidation.
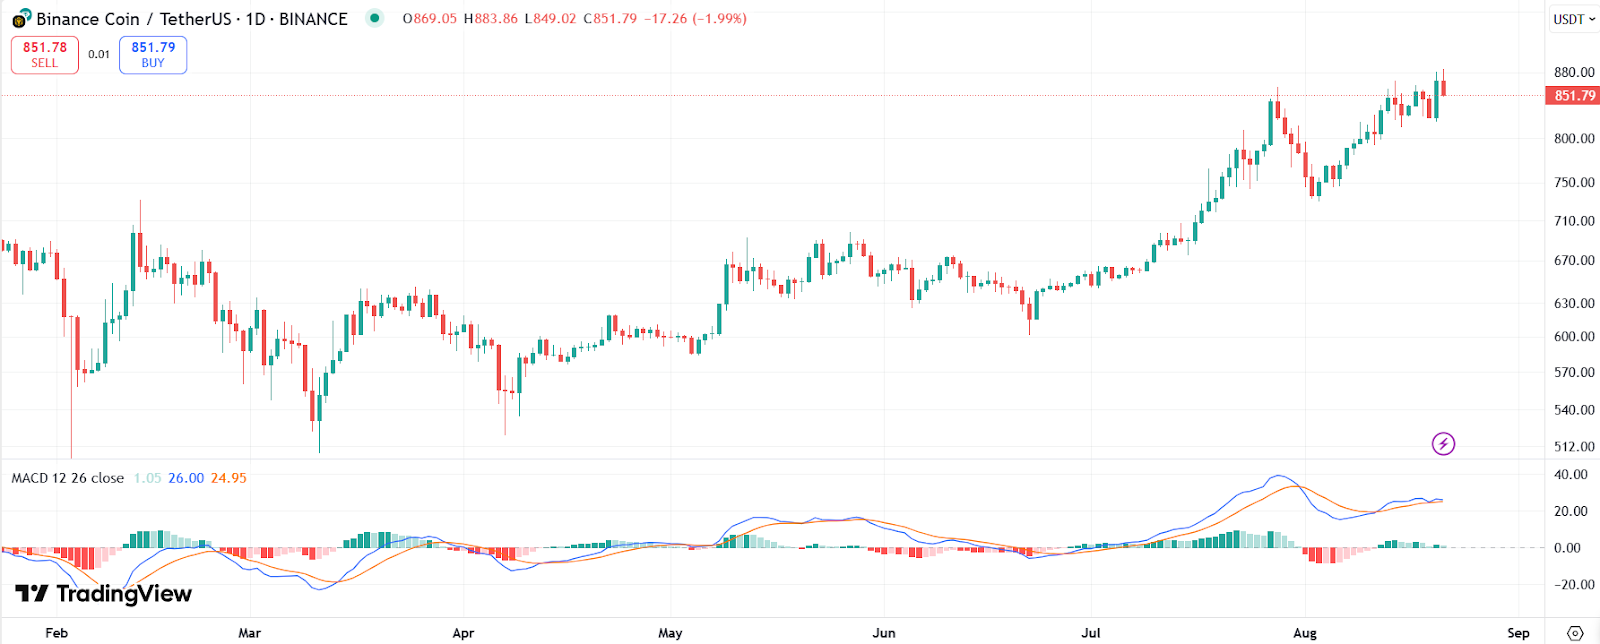
BNB price chart with MACD. | Source: Trading View