Bitget App
Trade smarter
Buy cryptoMarketsTradeFuturesEarnWeb3SquareMore
Trade
Spot
Buy and sell crypto with ease
Margin
Amplify your capital and maximize fund efficiency
Onchain
Going Onchain, without going Onchain!
Convert
Zero fees, no slippage
Explore
Launchhub
Gain the edge early and start winning
Copy
Copy elite trader with one click
Bots
Simple, fast, and reliable AI trading bot
Trade
USDT-M Futures
Futures settled in USDT
USDC-M Futures
Futures settled in USDC
Coin-M Futures
Futures settled in cryptocurrencies
Explore
Futures guide
A beginner-to-advanced journey in futures trading
Futures promotions
Generous rewards await
Overview
A variety of products to grow your assets
Simple Earn
Deposit and withdraw anytime to earn flexible returns with zero risk
On-chain Earn
Earn profits daily without risking principal
Structured Earn
Robust financial innovation to navigate market swings
VIP and Wealth Management
Premium services for smart wealth management
Loans
Flexible borrowing with high fund security
Render (RENDER) To Soar Further? Key Harmonic Pattern Hints at Potential Upside Move

Render (RENDER) To Soar Further? Key Harmonic Pattern Hints at Potential Upside Move

CoinsProbeCoinsProbe2025/08/23 19:05
By:Nilesh Hembade

Date: Fri, Aug 22, 2025 | 02:55 PM GMT

The cryptocurrency market turned bullish in the last hour after Jerome Powell hinted at potential rate cuts in September during today’s Jackson Hole event. Following the remarks, Ethereum (ETH) surged over 7% past $4,600, fueling strong momentum across altcoins, including Render (RENDER).

RENDER jumped by nearly 7% in the past hour, and its latest chart structure suggests that more upside may be on the way.

Render (RENDER) To Soar Further? Key Harmonic Pattern Hints at Potential Upside Move image 0 
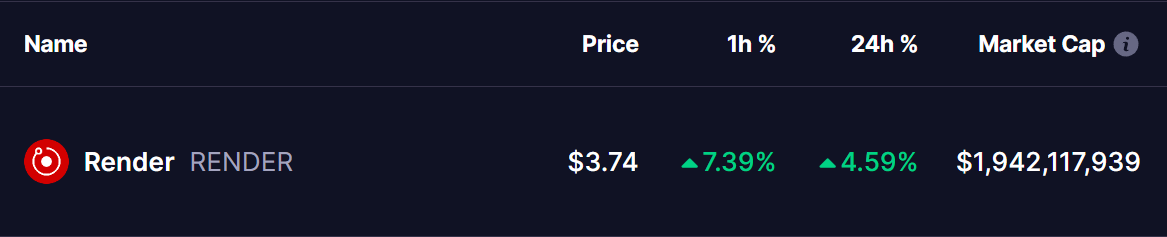
Source: Coinmarketcap

Harmonic Pattern Hints at Potential Upside

On the daily chart, RENDER is forming a Bearish Butterfly harmonic pattern. While the name sounds bearish, the final CD leg of this formation often signals a strong bullish continuation, especially as the price enters the Potential Reversal Zone (PRZ).

The pattern began at point X ($3.30), dropped to A, rebounded to B, and then corrected to point C near $3.41. Since then, RENDER has staged a recovery and is currently trading around $3.74, showing signs of strengthening momentum.

Render (RENDER) To Soar Further? Key Harmonic Pattern Hints at Potential Upside Move image 1 
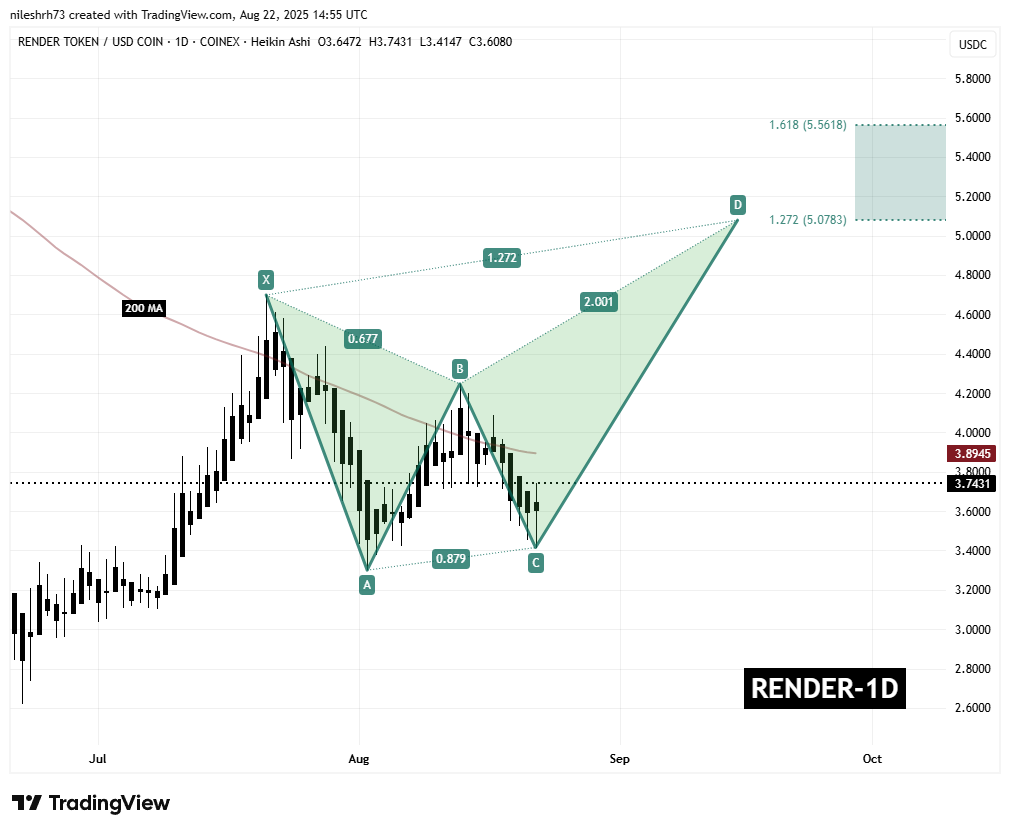
Render (RENDER) Daily Chart/Coinsprobe (Source: Tradingview)

Importantly, RENDER is trading just below its 200-day moving average ($3.89) — a critical level. A successful reclaim of this zone could flip it into strong support and accelerate bullish momentum.

What’s Next for RENDER?

If buyers defend the C-point support ($3.41) and push the price decisively above the 200-day MA, RENDER could rally into the PRZ between $5.07 (1.272 Fibonacci extension) and $5.56 (1.618 extension). These levels are historically significant zones where the Butterfly pattern tends to complete.

0

Disclaimer: The content of this article solely reflects the author's opinion and does not represent the platform in any capacity. This article is not intended to serve as a reference for making investment decisions.

PoolX: Earn new token airdrops
Lock your assets and earn 10%+ APR
Lock now!

You may also like

Solana’s proprietary AMMs are reshaping liquid asset markets for users

Prop AMMs like SolFi, HumidFi and Obric are taking over liquid capital markets

Blockworks2025/08/23 22:55
Solana’s proprietary AMMs are reshaping liquid asset markets for users