Shiba Inu golden cross on the hourly chart signals a short-term bullish momentum after the short-term moving average crossed above the long-term average, driving a spike to $0.0000135; traders should watch nearby SMA50/SMA200 levels and volume for confirmation.
-
Hourly golden cross confirmed: short-term SMA crossed above long-term SMA, prompting strong intraday buying.
-
Shiba Inu peaked at $0.0000135 on renewed Fed dovish hopes, then retraced amid profit-taking.
-
Daily SMA50 and SMA200 are converging; a death cross or golden cross on the daily chart will shape medium-term bias.
Shiba Inu golden cross signals short-term bullish momentum after an hourly SMA crossover; read COINOTAG analysis of levels, risks, and next steps for traders.
What is the Shiba Inu golden cross on the hourly chart?
Shiba Inu golden cross on the hourly chart is when a short-term moving average crosses above a longer-term moving average, indicating rising short-term momentum. The hourly SMA crossover produced immediate buying pressure and a spike to $0.0000135, signaling potential continuation if supported by volume.
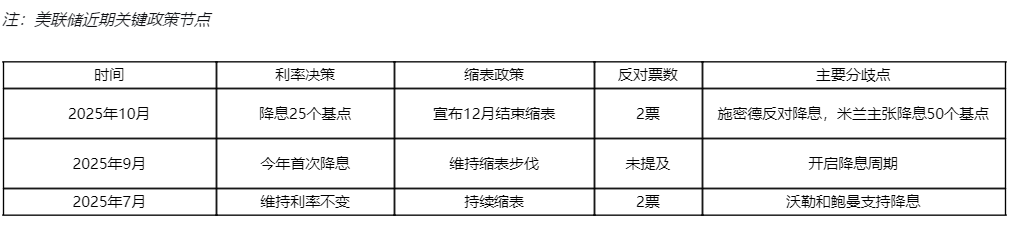
The hourly golden cross came as market participants digested dovish commentary from Fed Chair Jerome Powell at the Jackson Hole symposium and rising odds of a September rate cut. Short-term traders responded quickly, buying dips into the crossover.
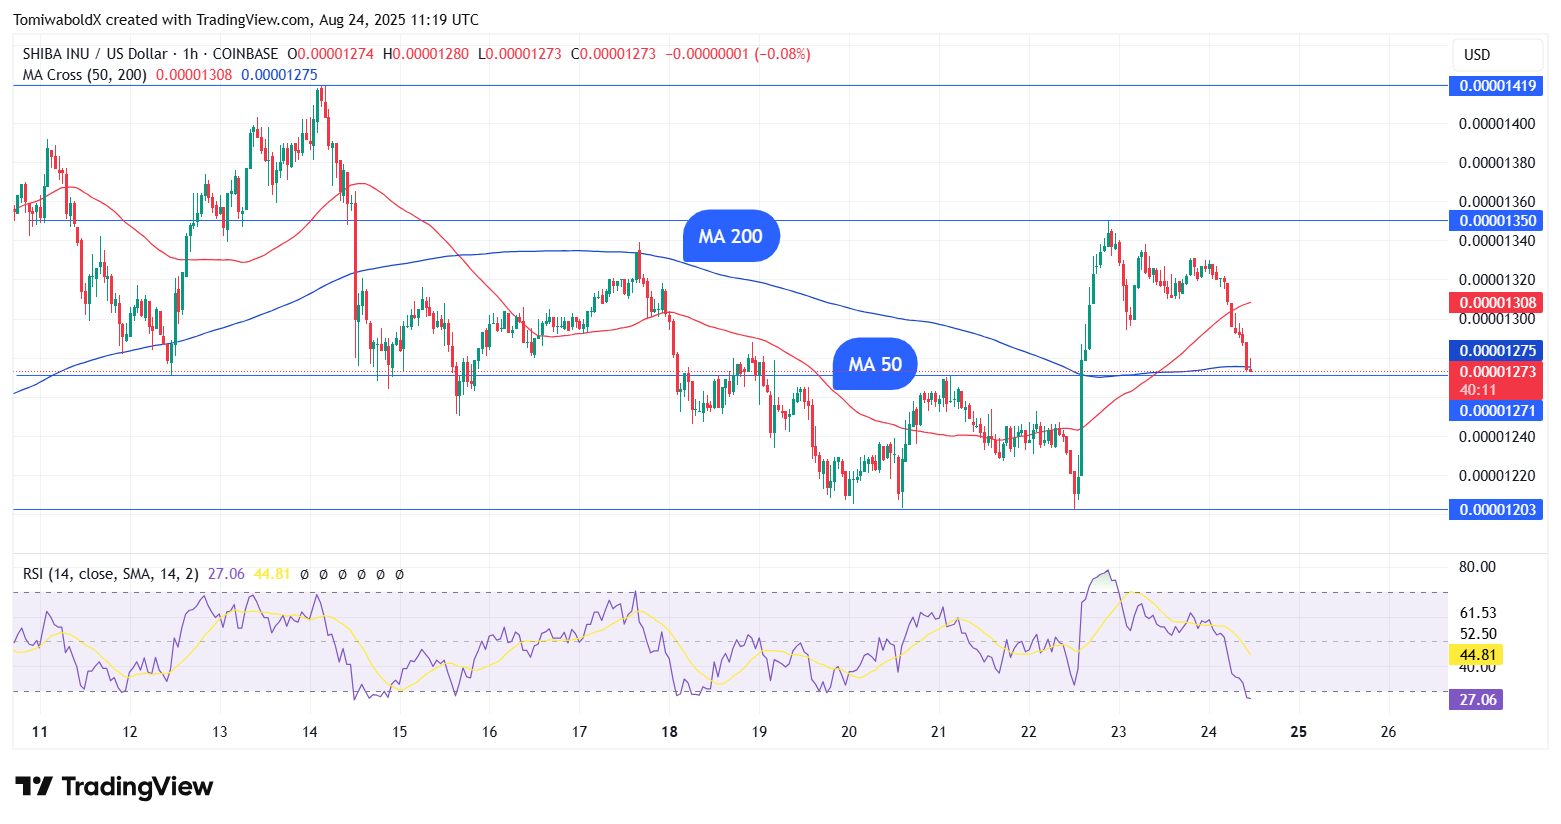
SHIB/USD Hourly Chart, Courtesy: TradingView
How did macro commentary influence the SHIB move?
Fed dovishness lowered short-term yields and boosted risk appetite, which supported altcoin demand, including SHIB. Traders reacted to higher perceived probability of a September rate cut by buying into short-term momentum plays.
Volume confirmed the initial move but profit-taking followed, producing a 3.2% intraday decline to $0.00001276 and a 3% weekly drop as traders locked gains.
Is Shiba Inu on the verge of a major daily crossover?
The daily SMA50 and SMA200 are converging and could produce either a golden cross or a death cross in the coming days. This convergence is notable because daily crossovers carry greater weight for medium-term market structure than hourly signals.
If a death cross forms, it would be the second daily death cross this year (the prior occurred in February 2025), which preceded a decline to roughly $0.00001. Conversely, the last daily golden cross in November 2024 preceded a run to $0.00003344 in subsequent weeks.
How should traders interpret these crossover scenarios?
- Hourly golden cross: Short-term bullish, use as a trigger for intraday or swing trades with tight stops.
- Daily crossover: Determines medium-term bias—golden cross favors bulls, death cross favors bears.
- Risk management: Watch volume, on-chain metrics, and macro headlines; set stop-losses below recent swing lows.
Frequently Asked Questions
What price levels should traders watch for Shiba Inu?
Watch $0.0000135 as the recent intraday peak and $0.0000120–$0.0000115 as short-term support. A sustained break below the daily SMA50 would increase downside risk toward $0.00001.
How likely is a daily golden cross versus a death cross?
Both outcomes are possible as the daily moving averages are flattened and converging. Probability depends on near-term price direction and macro catalysts; monitor daily closes for confirmation.
Key Takeaways
- Hourly golden cross confirmed: Intraday bullish momentum pushed SHIB to $0.0000135 before profit-taking.
- Daily crossover imminent: SMA50 and SMA200 convergence could produce a decisive medium-term signal.
- Manage risk: Confirm with volume and macro cues, and use disciplined stop-losses to protect capital.
Conclusion
The Shiba Inu hourly golden cross indicates short-term bullish momentum, while the approaching daily SMA convergence will determine medium-term direction. Traders should combine crossover signals with volume, on-chain metrics, and macro updates to form a data-driven plan. COINOTAG will monitor developments and update the analysis as new data appears.