Date: Sun, Aug 24, 2025 | 07:05 PM GMT
The cryptocurrency market continues to ride the bullish wave after Ethereum (ETH) hit a fresh all-time high of $4,900 this today, sparking upside momentum across major altcoins — including Kaspa (KAS).
While KAS has posted modest gains today, its chart is now flashing a technical setup that could pave the way for a stronger upside: a key harmonic pattern pointing toward higher prices in the near term.
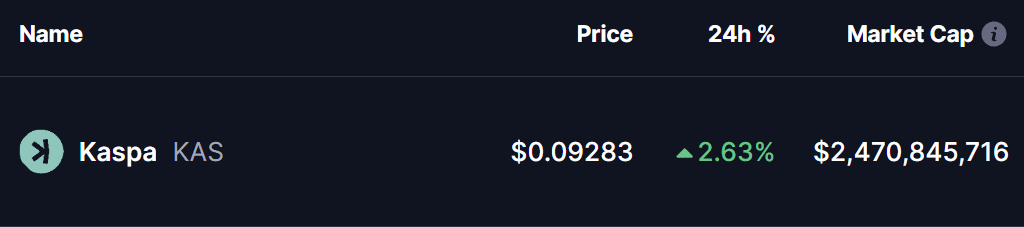 Source: Coinmarketcap
Harmonic Pattern Hints at Bullish Continuation
On the daily timeframe, KAS is forming a Bearish Bat harmonic pattern — and despite its name, the ongoing CD leg of this structure often signals a strong bullish continuation before the pattern completes.
The sequence began near $0.1179 at point X, retraced down to point A, bounced to point B, and corrected again to point C around $0.0830. Since then, KAS has steadily rebounded and is now trading near $0.0923, climbing along the CD leg toward its projected target zone.
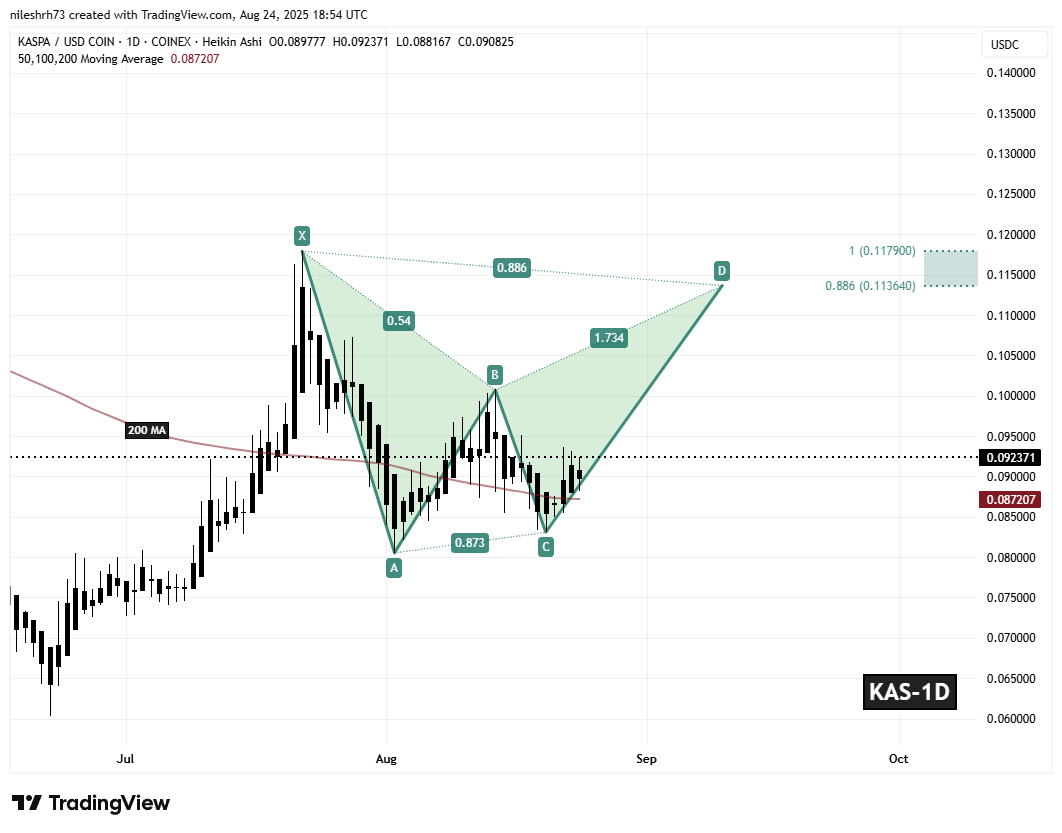 Kaspa (KAS) Daily Chart/Coinsprobe (Source: Tradingview)
Adding to the bullish case, KAS is holding above its 200-day moving average at $0.087, a critical level that may serve as a strong base for further upside momentum.
What’s Next for KAS?
If this harmonic structure plays out, the Potential Reversal Zone (PRZ) sits between $0.1136 and $0.1179, corresponding with the 0.886 and 1.0 Fibonacci retracement levels. From current levels, this implies a potential rally of up to 27%.
However, the bullish scenario hinges on KAS maintaining its footing above the 200-day MA. A breakdown below this level could invalidate the pattern and delay any near-term upside.