Bitcoin market cycles are driven primarily by adoption trends, market structure and liquidity dynamics rather than strictly by halving events. Analyst James Check identifies three cycles—adoption, adolescence, maturity—where retail activity, leverage and institutional inflows set bull and bear phases.
-
Three adoption-driven cycles: adoption, adolescence, maturity
-
Halvings influence supply but liquidity and institutional flows often determine cycle timing.
-
Glassnode and market analysts signal a late-phase cycle with elevated selling pressure and profit taking.
Bitcoin market cycles explained: adoption, leverage, and institutional maturity drive trends more than halvings — read expert analysis, charts, and key takeaways now.
What are Bitcoin market cycles?
Bitcoin market cycles are multi-year phases of market expansion and contraction defined by adoption, leverage dynamics and liquidity conditions. These cycles describe transitions from retail-driven booms to leveraged corrections and then to institutional maturity, shaping price peaks and troughs more than the date of halvings.
How do halving events affect Bitcoin cycles?
Halving events reduce miner rewards and can create supply-side constraints, often coinciding with bullish momentum. Historically, major price peaks followed halvings (price peaks in 2013, 2017, 2021), but analyst James Check argues the core drivers are adoption trends and market structure, not the halving clock alone.
Analyst James Check argued Bitcoin has seen three market cycles driven by adoption trends rather than halving events as widely believed.
Bitcoin’s market cycles are not anchored around its halving events as widely believed, according to analyst James Check, who says other factors drive bull and bear cycles.
“In my opinion, Bitcoin has experienced three cycles, and they are not anchored around the halvings,” Check said on Wednesday, referring to the blockchain’s cutting of mining rewards that typically occurs every four years.
He said that market cycles are anchored around the “trends in adoption and market structure,” with the market’s 2017 peak and 2022 bottom being the transition points.
Check highlighted the three previous cycles as an “adoption cycle” from 2011 to 2018, driven by retail early adoption, an “adolescence cycle” from 2018 to 2022, driven by “Wild West boom and bust with leverage,” and the current “maturity cycle” from 2022 onward, driven by “institutional maturity and stability.”
“Things changed after the 2022 bear market, and folks who assume the past will repeat likely miss the signal because they are looking at the historical noise,” he said.
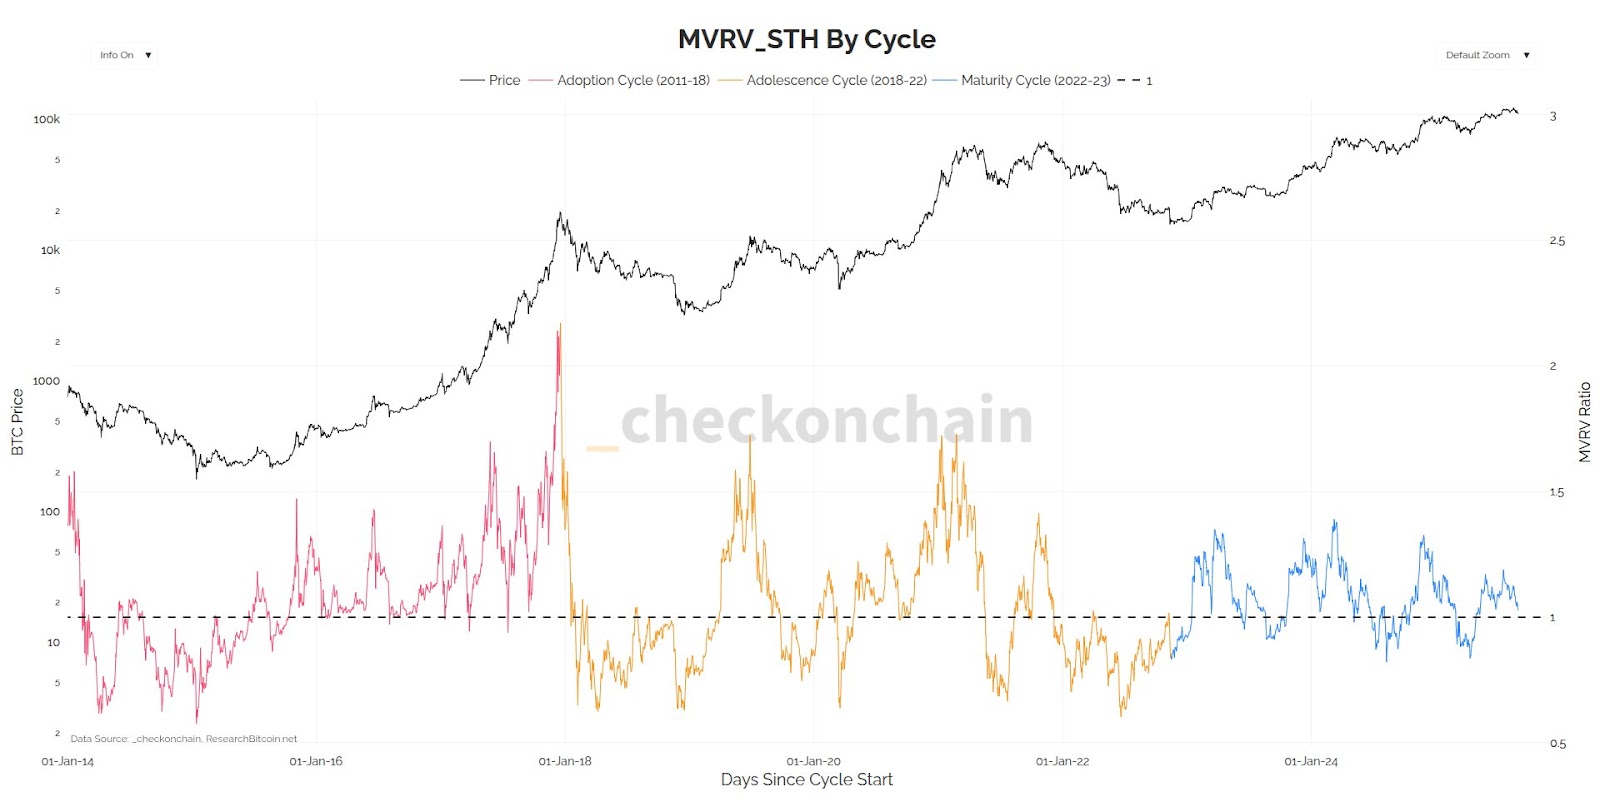
Bitcoin’s price (black) compared to James Check’s take on the cryptocurrency’s market cycles. Source: James Check
Why do some analysts still support the halving cycle theory?
Proponents of the halving-cycle theory point to repeated historical patterns where the bull-market peak occurred in the year after a halving (e.g., 2013, 2017, 2021). These observers argue that halvings create a predictable supply shock that, combined with steady demand, helps explain multi-year cycles. Yet recent commentary suggests liquidity, macro conditions and ETF inflows can extend or compress those phases.
When might the current cycle end?
Analysts at Glassnode signaled on Aug. 20 that Bitcoin was still tracking traditional cycle patterns and that recent profit taking and selling pressure “suggests the market has entered a late phase of the cycle.” Position trader Bob Loukas commented that cycles are perpetual: “We pump until it bursts, because we just want more. Then we start again.” These views indicate the current maturity cycle may be approaching a transitional phase, driven by realized profits and shifting liquidity.
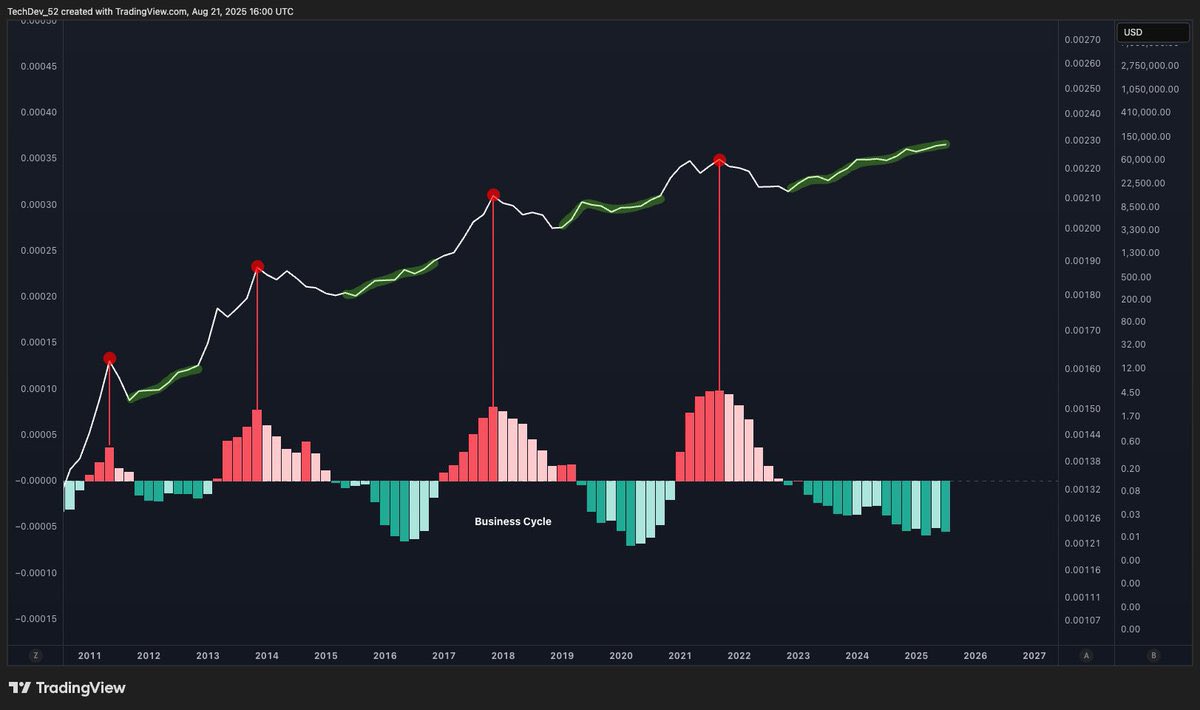
Macroeconomic factors such as dollar liquidity and ETF inflows may have extended the bullish phase. Source: TechDev
How should investors interpret cycle signals?
-
Monitor liquidity and inflows: ETF flows and dollar liquidity often dictate cycle extensions.
-
Watch on-chain metrics and exchange reserves for selling pressure signals (Glassnode-style analysis).
-
Differentiate structural adoption trends from short-term hype to avoid leverage-driven blowups.
Frequently Asked Questions
How reliable is the four-year Bitcoin cycle?
The four-year cycle has historical precedent but is not infallible. Market structure, liquidity, institutional flows and macro conditions can extend or shorten cycles, making strict reliance on a calendar-based cycle risky.
What should traders watch for in the current maturity cycle?
Traders should monitor ETF inflows, exchange reserves, realized profit metrics and macro liquidity. These indicators better signal phase transitions than the date of the last halving.
Key Takeaways
- Adoption matters: Adoption and market structure, not halvings alone, anchor long-term cycles.
- Liquidity drives timing: ETF flows, dollar liquidity and leverage dictate cycle length and intensity.
- Measure, don’t assume: Use on-chain and macro indicators to identify late-phase signals and manage risk.
Conclusion
Analyst James Check’s framework reframes Bitcoin market cycles as adoption and liquidity phenomena rather than strictly halving-driven events. Combining on-chain data, macro liquidity measures and institutional flow analysis improves cycle interpretation. Monitor these signals and revisit allocations as the market transitions to the next phase.
![[Bitpush Daily News Highlights] Texas Lieutenant Governor officially announces the purchase of bitcoin, aiming to build America’s digital future hub; Economists expect the Federal Reserve to cut interest rates in December, with two more possible cuts in 2026; Circle has issued an additional 10 billions USDC in the past month; Sources: SpaceX is in talks over share sales, with valuation possibly soaring to 800 billions USD.](https://img.bgstatic.com/multiLang/image/social/dd58c36fde28f27d3832e67b2a00dab41764952203123.png)