Ether ETFs capture 10x more inflows than Bitcoin in 5 days
Spot Ether exchange-traded funds are selling like hot cakes in the US, attracting more than 10 times the inflows of their spot Bitcoin counterparts over the past five trading days.
Since Aug. 21, spot Ether ETFs have seen a whopping $1.83 billion in inflows, while Bitcoin funds took only a 10th of that with $171 million, according to CoinGlass.
The latest trading day on Wednesday continued the trend, with nine Ether
ETH$4,596funds reaching $310.3 million in inflows, while the 11 spot BitcoinBTC$113,119funds saw just $81.1 million.
Ether has recovered faster than Bitcoin this week, with ETH prices climbing 5% from their Tuesday low , whereas Bitcoin only managed to gain 2.8% over the same period.
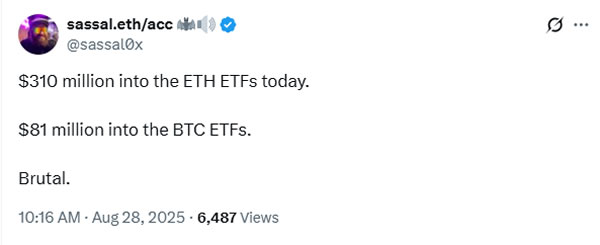
The massive shift to Ether was not missed by industry observers such as Ethereum educator and investor Anthony Sassano, who described it as “brutal.”
 Source: Anthony Sassano
Meanwhile, NovaDius Wealth Management president Nate Geraci added that spot Ether ETFs are now close to $10 billion in inflows since the start of July.
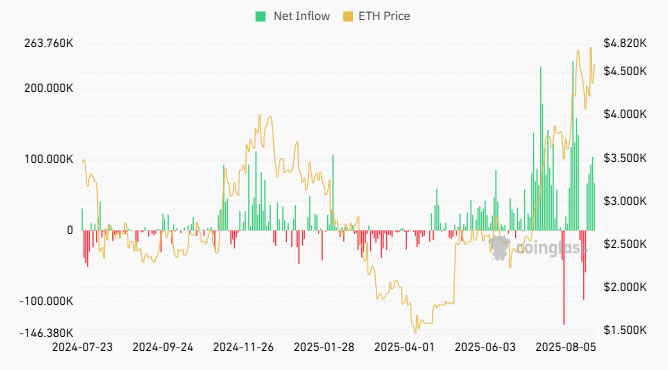
Spot Ether ETFs have been trading for 13 months and have seen $13.6 billion in total aggregate inflows, the majority of which has come in the last couple of months.
Spot Bitcoin ETFs have been around longer, trading for 20 months with an aggregate inflow of $54 billion.
The Wall Street token
The momentum has seemingly been shifting to Ethereum following the passing of the GENIUS Act stablecoin legislation in July, as the network has the largest market share of stablecoins and tokenized real-world assets.
“It’s very much what I call the Wall Street token,” said VanEck CEO Jan van Eck, speaking on Fox Business this week.
Meanwhile, Bloomberg ETF analyst James Seyffart reported that investment advisers were the top holders of Ether ETFs with $1.3 billion in exposure. According to SEC filings, Goldman Sachs is the top holder with $712 million in exposure.
 Ether ETF inflows have surged over the past couple of months. Source: CoinGlass
ETH was trading down 1.2% on the day at $4,560 at the time of writing, according to CoinGecko.
Disclaimer: The content of this article solely reflects the author's opinion and does not represent the platform in any capacity. This article is not intended to serve as a reference for making investment decisions.
You may also like
Coinpedia Digest: This Week’s Crypto News Highlights | 29th November, 2025
QNT Price Breaks Falling Wedge: Can the Bullish Structure Push Toward $150?

Digital dollar hoards gold, Tether's vault is astonishing!

The Crypto Bloodbath Stalls: Is a Bottom In?

