Bitcoin News Today: Bitcoin's Descent Tests $100K: A Bull Trap or Buying Opportunity?
- Bitcoin fell below $110,000 to a seven-week low near $108,700, raising concerns about a potential bull trap after a 12% correction from its $124,000 peak. - Technical indicators show bearish momentum with RSI below 50, broken key levels like the 100-day moving average, and critical support at $100,000 under pressure. - Market factors include Fed rate cut speculation, ETF outflows, and large investor liquidations, while on-chain data shows declining exchange reserves but no short-term price insulation. -
Bitcoin has recently retreated below the $110,000 level, triggering growing concerns among investors and analysts following a sharp price correction. The cryptocurrency, which had reached a record high of over $124,000 in early August, has since dropped nearly 12%, reaching a seven-week low near $108,700 [2]. This move has raised the possibility of a potential bull trap, where an initial rally is followed by a sharp reversal, potentially catching investors off guard [2]. The recent pullback has seen Bitcoin break through multiple key technical levels, including the descending channel and the 100-day moving average, signaling a bearish shift in market sentiment [1].
Technical indicators have also reinforced the bearish bias, with the relative strength index (RSI) falling below 50 and showing signs of waning buying momentum [1]. On the 4-hour chart, Bitcoin has formed a consistent downtrend, with lower highs and lower lows within a descending channel, reinforcing the likelihood of a continuation of the decline [1]. Key support levels, such as $107,000 and $100,000, are now under pressure, with the latter aligning with the 200-day moving average and a potential accumulation zone for investors [2].
The broader market context has also contributed to the recent decline. The comments from Federal Reserve Chair Jerome Powell, which hinted at the possibility of an interest rate cut, led to a reversal of the previous week’s gains [2]. Additionally, reports of increased liquidations among large investors and rising outflows from Bitcoin ETFs have added to the downward pressure [2]. These factors suggest that macroeconomic conditions and shifting risk appetite are playing a key role in the current price action.
On-chain data also provides mixed signals. Exchange reserves—the amount of Bitcoin held on trading platforms—have been on a steady decline since early 2024, indicating a growing preference among investors and institutions to move their holdings into cold storage [1]. While this trend typically supports higher prices in the long run by reducing circulating supply, it does not necessarily insulate Bitcoin from short-term corrections, especially during periods of weak demand or macroeconomic uncertainty [1].
Analysts are closely watching the $104,000 level, which coincides with a fair value gap and the 78.6% Fibonacci retracement level. A breakdown below this threshold could expose the next key support area near the psychological $100,000 mark [1]. Resistance levels at $117,000 and $123,000 remain in focus, with the former posing a potential barrier to a near-term recovery [2]. The way Bitcoin reacts to these levels will likely determine the near-term trajectory of the market.
Source:

Disclaimer: The content of this article solely reflects the author's opinion and does not represent the platform in any capacity. This article is not intended to serve as a reference for making investment decisions.
You may also like
Solana News Today: Solana's 150ms Finality Revolution: Could It Outrace Ethereum?
- Solana's validator community nears approval of Alpenglow upgrade, slashing block finality to 150ms via Votor and Rotor components. - Upgrade enables 107,540 TPS (vs. Ethereum's 15-45 TPS) and introduces decentralized economic incentives to reduce centralization risks. - 99% voter support with 33% quorum met, positioning Solana to challenge Ethereum in DeFi, gaming, and institutional finance sectors. - Critics warn VAT model may favor large validators, but network's 20+20 resilience model and $8.6B DeFi T

VANA -116.86% in 24 Hours Amid Sharp Decline in Volatility and Liquidity
- VANA’s 24-hour price drop of 116.86% reflects severe market pressures and liquidity decline. - Analysts attribute the decline to reduced liquidity and shifting investor sentiment toward established assets. - Technical indicators (RSI, MACD) remain bearish, with no stabilizing forces in the ecosystem. - A backtesting strategy evaluates RSI/MACD signals to predict trend continuation or reversal. - Prolonged bearish momentum highlights structural weaknesses in VANA’s market resilience.

COW -6255.05% in 1 Year Amid Sharp Short- and Mid-Term Price Declines
- COW's price plummeted 127.26% in 24 hours, 6255.05% annually, marking extreme bearish momentum. - Technical indicators show COW trading below key moving averages with RSI in oversold territory, lacking reversal signals. - Analysts warn of continued downward pressure, noting no near-term support levels to halt the decline. - Backtesting strategies suggest adapting to bearish bias using RSI divergence and bearish crossovers for shorting opportunities.

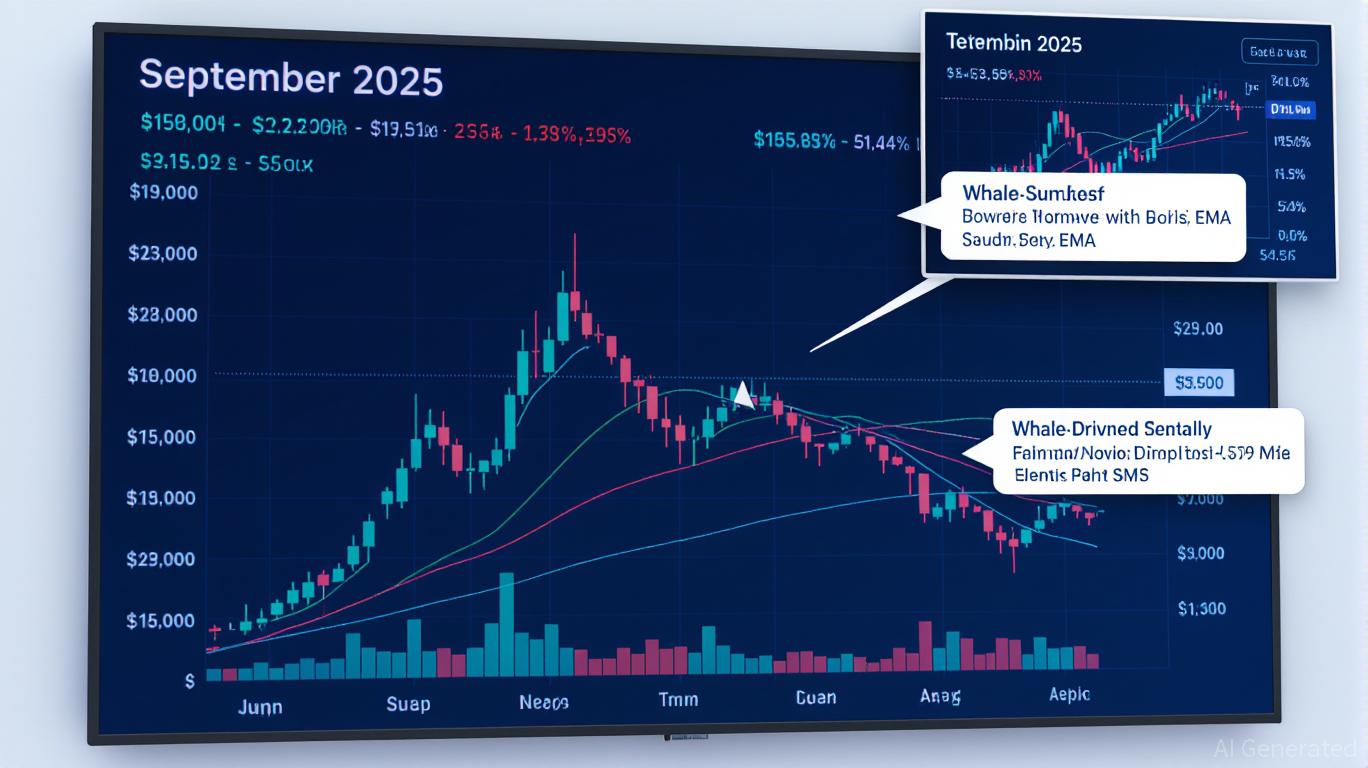
Bitcoin's 'Red September' Risk: Whale Sell-Offs and Market Vulnerability
- Bitcoin's "Red September" pattern sees average 3.77% monthly declines since 2013, driven by seasonal rebalancing and Fed policy uncertainty. - A $2.7B whale selloff in August 2025 triggered a $100B market crash, highlighting large holders' outsized influence on liquidity. - Institutional profit-taking reached $3.5B in September 2025, with synchronized selling across all wallet groups signaling a maturing market. - Growing institutional adoption (ETF inflows, record futures open interest) has reduced corr