Bitcoin Price August Closing: Building from the Ground Up or Is the Bull Market on Pause?

The bitcoin market is at a critical turning point, with the price dropping to $108,000 for the first time in August, facing resistance at $110,000. Historical data shows that September is typically a weak period for bitcoin, and market sentiment is divided, with analysts holding differing views on the short-term outlook. Summary generated by Mars AI This summary was generated by the Mars AI model, and the accuracy and completeness of its content are still being iteratively updated.
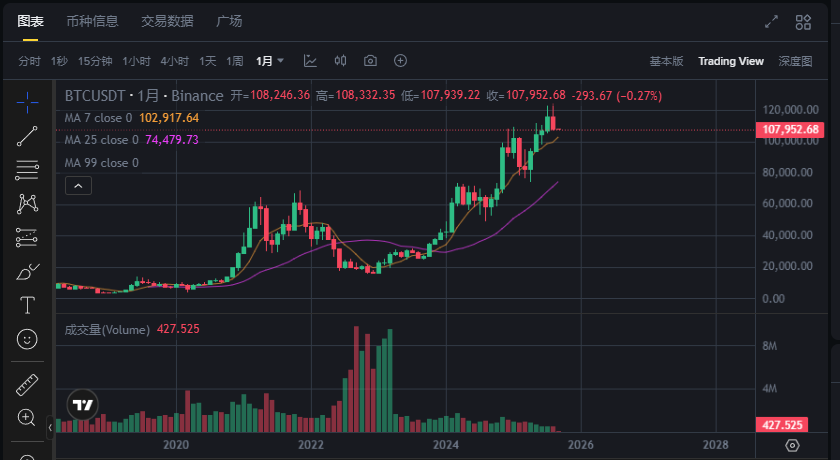
The Bitcoin market has once again reached a critical turning point. As of today, September 1, Bitcoin’s August closing price was around $108,000, marking the first monthly decline since April.
The current Fear and Greed Index has dropped to a neutral 47. Retail investors no longer feel the euphoria of Bitcoin’s record highs at the beginning of the month, while whales are hesitating between buying more or selling amid the ongoing decline.
The market is caught in an intense tug-of-war between the historic “September curse” and bullish technical signals that could lead to new highs. This contradiction and uncertainty have set the stage for September’s market performance.
Historical Patterns: September as Bitcoin’s Traditional Weak Period
Since Bitcoin began trading, September has been known for its weak performance.
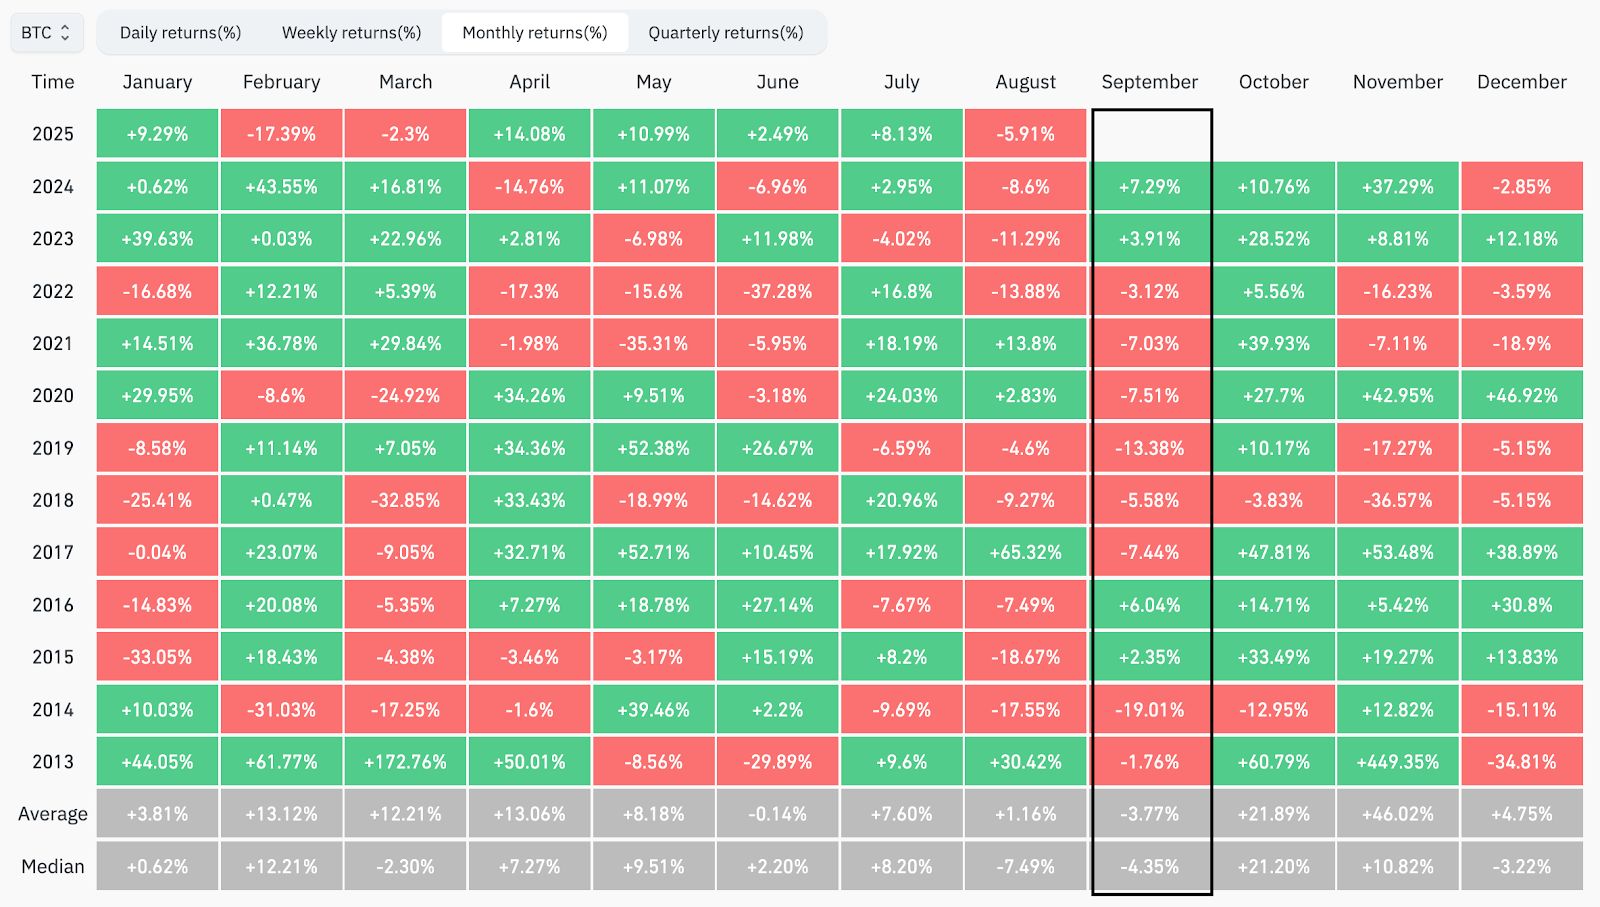 Bitcoin Monthly Returns
According to historical data from Coinglass, Bitcoin’s average decline in September is 3.77%, making it one of only two months in the year with a negative average return.
A deeper look at the data reveals that in the past 14 years, Bitcoin has declined in September in 10 of those years, with a probability as high as 71.4%. Notably, in September 2011, Bitcoin plummeted 37.65%, marking its worst single-month performance ever.
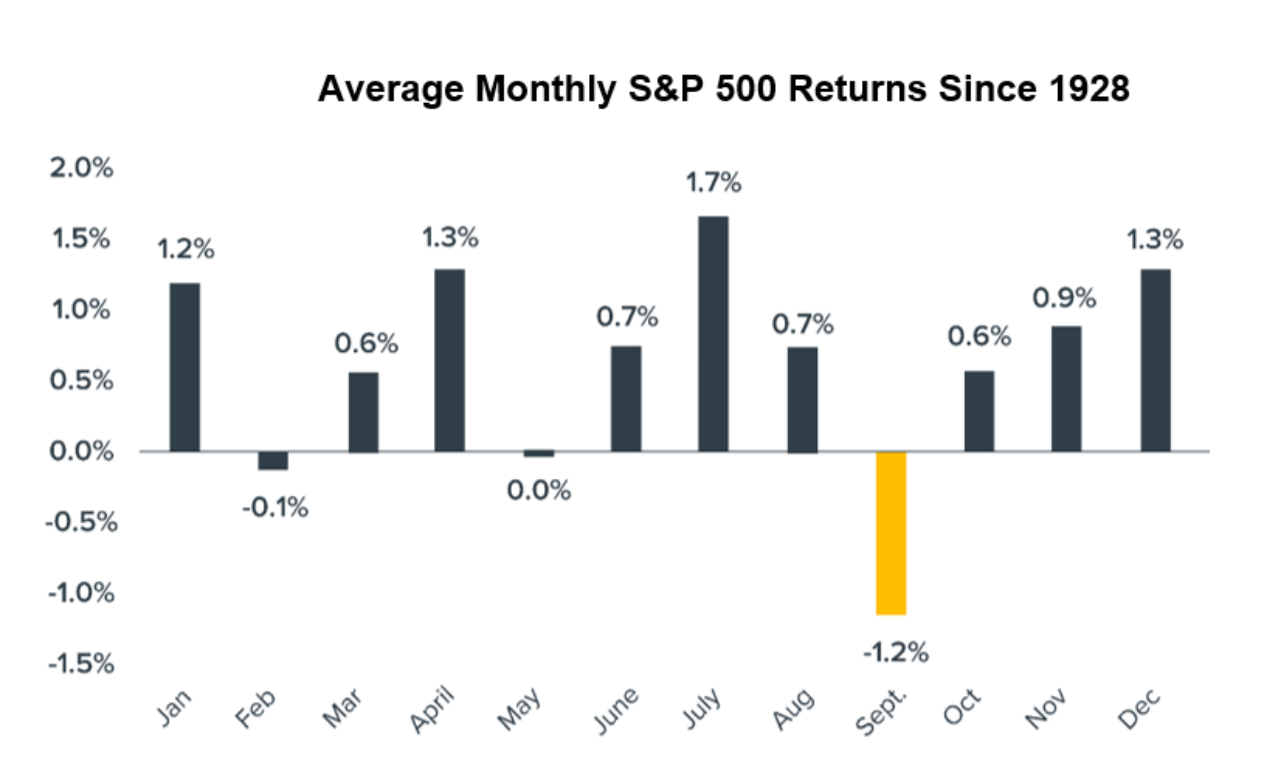 S&P 500 Average Monthly Returns Since 1928
The traditional stock market also experiences the “September Effect.” Since 1928, the S&P 500’s average return in September is about -1.2%, making it the only month with consistently negative performance. This seasonal weakness has plagued the market for nearly a century.
This regular decline is supported by market mechanisms. Mutual funds typically end their fiscal year in September, triggering tax-loss harvesting and portfolio rebalancing, which releases a large number of sell orders into the market.
Multiple Factors: Deep-Rooted Causes of September Weakness
The formation of the “Red September” is not accidental but the result of multiple factors working together.
Yuri Berg, an advisor at Swiss crypto liquidity provider FinchTrade, pointed out: “This pattern is easy to predict: negative discussions on social media surge around August 25, followed by an increase in Bitcoin exchange deposits within 48-72 hours.”
Liquidity contraction is one of the core factors. After the summer holidays, traders return to their desks and reassess positions after months of low liquidity. Meanwhile, bond issuance surges after Labor Day, and institutional funds begin shifting from stocks and risk assets to fixed-income products.
Uncertainty in Federal Reserve policy also exacerbates market volatility. The Federal Open Market Committee (FOMC) holds its meeting in September, and this policy uncertainty often freezes buying until the policy direction becomes clear.
In the crypto sector, these pressures are further amplified: Bitcoin trades 24/7, and there is no “circuit breaker” when sell-offs accelerate. Additionally, the overall market cap is smaller, making it more susceptible to whale capital flows.
Recent Performance: Market Shows Signs of Fatigue and Downward Pressure
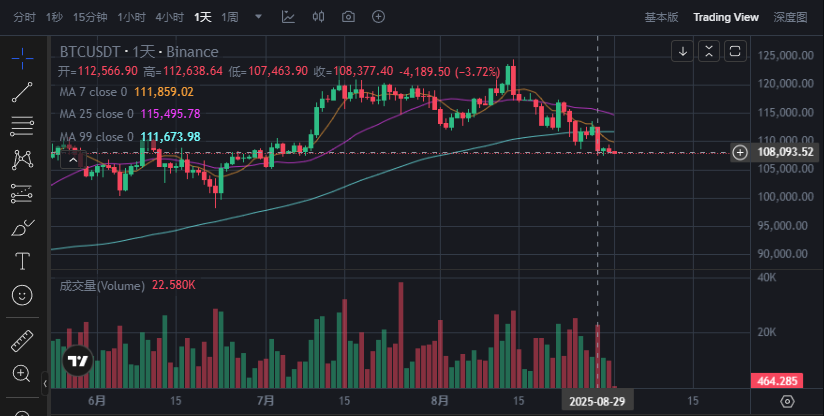
The market already showed signs of weakness at the end of August. On August 26, Bitcoin fell to $108,717, marking its fourth consecutive day of decline. Ethereum also saw a sharp correction, dropping to $4,314, down 13% from its all-time high. On August 29, after a brief rebound, Bitcoin again plunged to a low of $107,300, triggering large-scale liquidations.
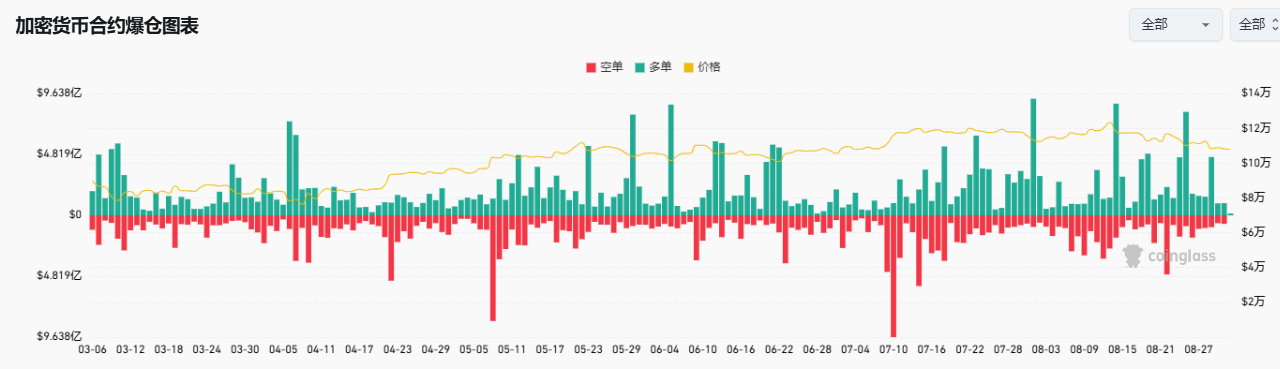
According to CoinGlass data, the volume of long liquidations in the past month has far exceeded that of January to July, with a rapid chain reaction in the market and mainstream altcoins coming under pressure across the board.
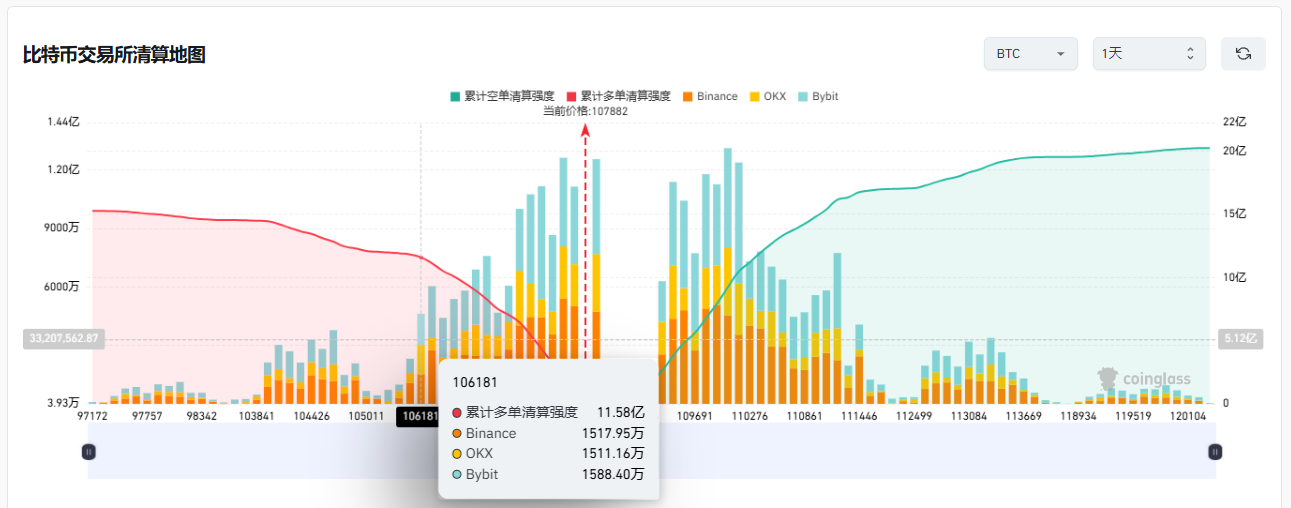
According to Coinglass data, if Bitcoin falls to $106,000, more than $1.1 billions in long positions could be liquidated.
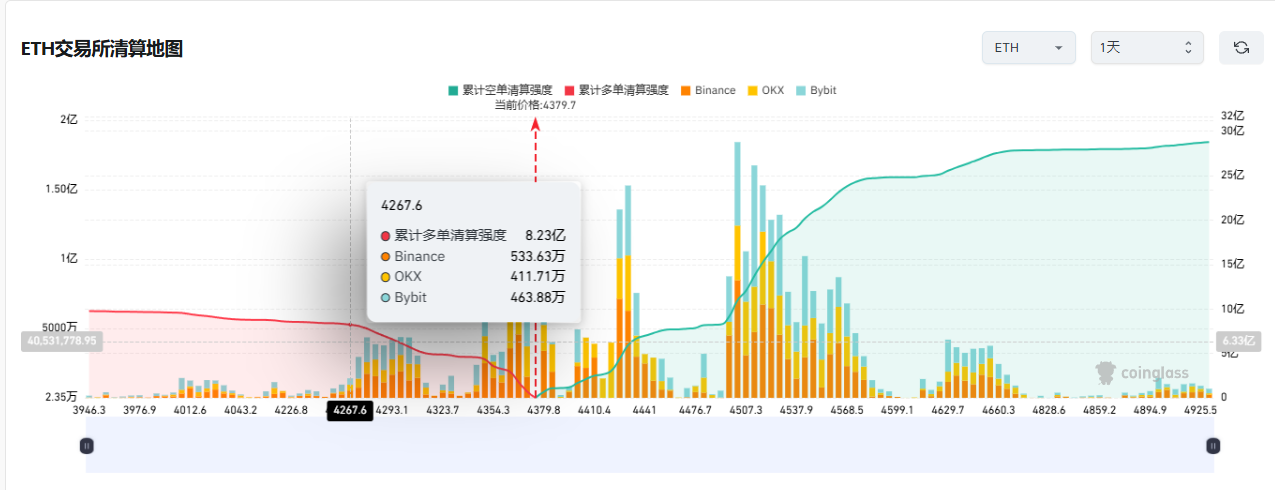
According to Coinglass data, if Ethereum falls to $4,260, more than $800 millions in long positions could be liquidated.
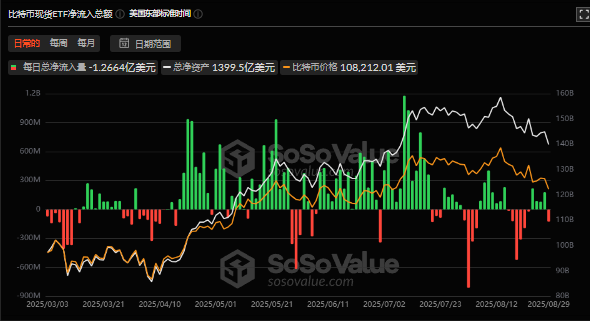
ETF inflows have slowed further, intensifying bearish pressure. In the past two weeks, Bitcoin ETFs saw outflows of nearly $1.5 billions, indicating weakening institutional investor confidence.
On-chain data also reveals structural signals. Glassnode pointed out that all Bitcoin holder groups “have collectively entered the distribution phase,” highlighting the broad selling pressure the market is experiencing.
Divergent Outlooks: Market Analysts Split on Prospects
Faced with a complex market environment, analysts have significantly diverged in their short-term outlooks.
Some analysts believe Bitcoin may retest the $100,000 level.
Dr. Profit predicts a possible drop below $100,000 in September, followed by a rebound.
Doctor Profit adds a pessimistic view from both macro and psychological perspectives. He believes that the Fed’s rate cut in September is less of a positive and more of a trigger for uncertainty. Unlike the “soft landing” rate cuts of 2024, this time may be a true “major turning point.”
However, other analysts disagree. Rekt Fencer stated: “Bitcoin will not fall below $100,000 this cycle and will set new highs again.”
Analyst Rekt Fencer said that based on Bitcoin’s 2017 performance, there will be “no September crash” this year.
The charts for 2017 and 2025 show an almost mirror image. In both cycles, Bitcoin experienced a sharp drop at the end of August, stabilized at key support, and then reversed higher.
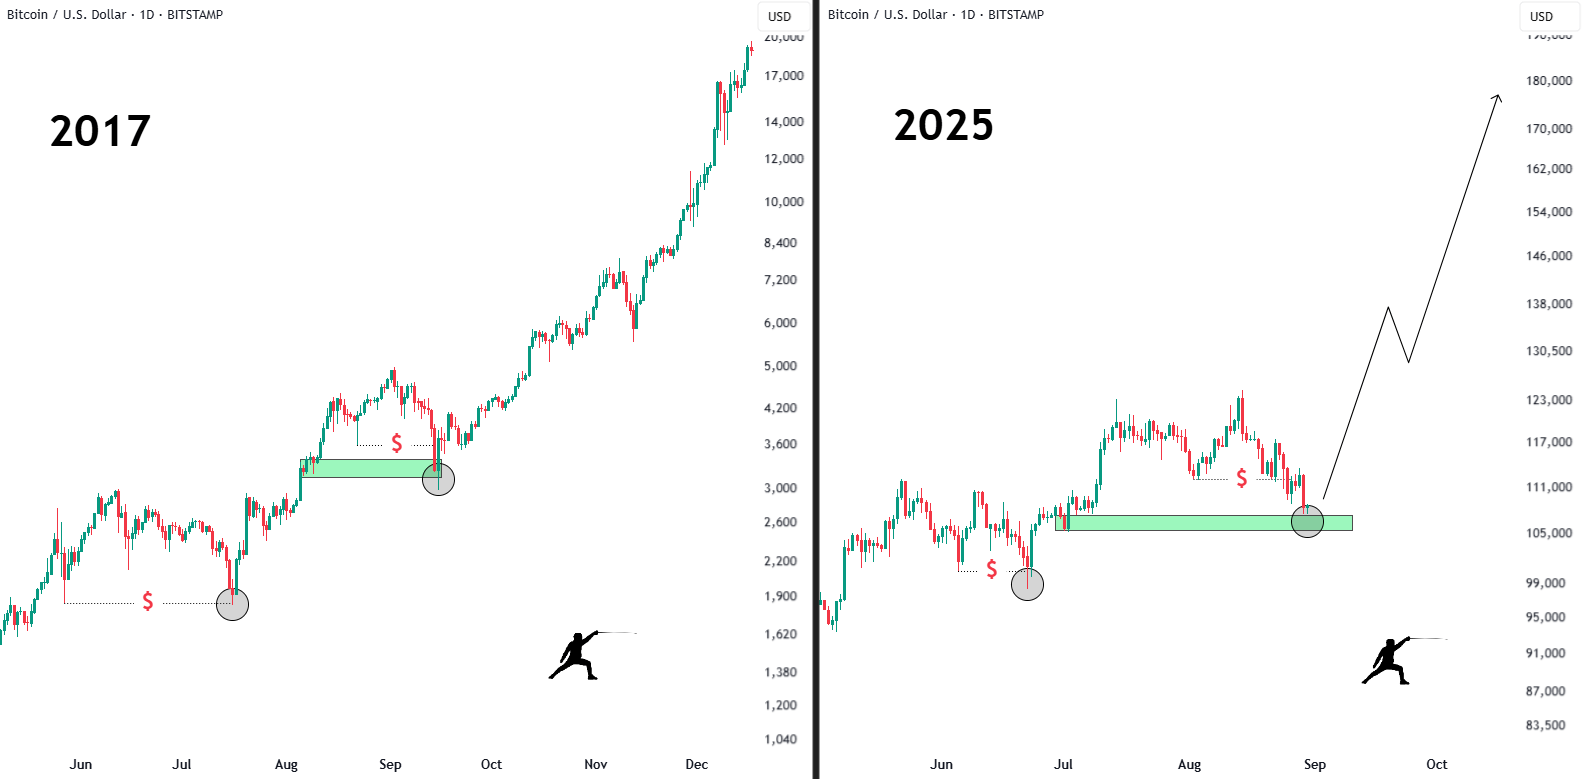 Comparison of BTC/USD Daily Price Trends in 2017 and 2015.
Back in 2017, that retest marked the last shakeout before BTC’s price soared to $20,000.
Fast forward to today, Bitcoin is once again hovering near the multi-month base between $105,000 and $110,000, a level that could serve as a launchpad for another parabolic rally.
Macro Environment: Weakening Dollar May Be a Supporting Factor
Changes in the macroeconomic environment may provide support for Bitcoin. Due to the slowing U.S. economy and expectations of Fed rate cuts weighing on market sentiment, currency traders have turned bearish on the dollar. They expect the dollar to fall another 8% this year, and criticism of the Fed by Donald Trump has intensified the decline.
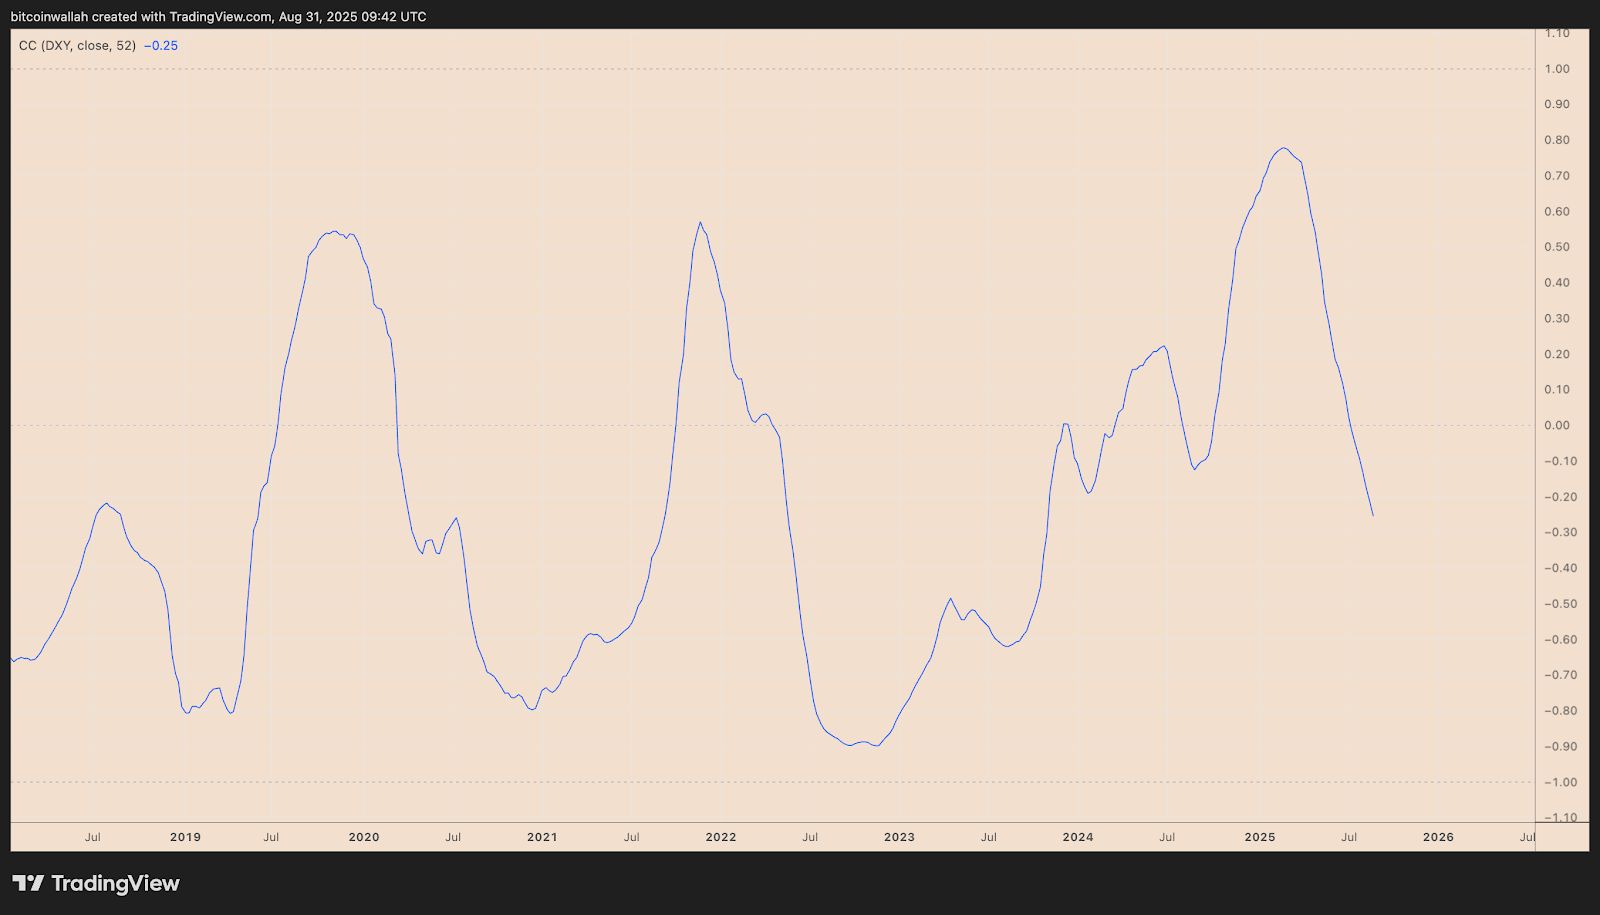 BTC/USD and DXY 52-Week Correlation Coefficient.
Recently, the 52-week correlation between Bitcoin and the U.S. Dollar Index (DXY) has dropped to -0.25, the lowest in two years. This strengthening negative correlation means that if the dollar continues to fall, the likelihood of Bitcoin rising increases.
The Fed’s policy direction remains a key variable. The market generally expects the Fed to cut rates again at its September 18 meeting. However, core inflation remains stuck at 3.1%, and two ongoing wars are disrupting global supply chains, creating a “perfect storm.”
Analyst Ash Crypto stated: “The Fed will start the printing press in Q4 this year,” adding, “Two rate cuts mean trillions of dollars will flow into the crypto market. We are about to enter a parabolic phase, with altcoin prices soaring 10 to 50 times.”
Three Scenarios: Possible Paths for September’s Market
Based on the current market situation, the author points out three possible scenarios.
Drop Before Surge—If BTC falls, its price could drop to $100,000–$104,000, flushing out over-leveraged longs. Afterwards, a strong rebound could push it to $130,000, with the bull market support band (BSB) near $106,000 serving as a springboard.
Holding the Line—On the other hand, if BTC holds the $107,000–$110,000 area, it could quickly reclaim $114,500 and move higher, especially if rate cuts add momentum.
Worst-Case Bearish Signal—The real danger lies in a deeper drop. A fall toward the 50-week moving average ($92,000–$98,000) would signal a trend reversal, as historically, breaking below this level has marked the cycle top, such as in 2017 and 2021.
The market currently believes that a wide-range oscillation/consolidation is the most probable scenario. In this case, mixed news from both bulls and bears leads to a lack of clear direction, with balanced buying and selling forces causing prices to fluctuate within a broad range.
Conclusion
Historical data shows that Bitcoin indeed struggles to escape the shadow of the “September curse.”
But the different picture painted by technical analysis is also worth noting: the key support area of $100,000–$106,000, hidden bullish divergences, and the macro environment of a weakening dollar may together help Bitcoin achieve an unexpected rebound in September.
The market always seeks direction amid uncertainty. September may be a test for Bitcoin, but it is also an opportunity—volatility means risk, but also potential rewards.
Disclaimer: The content of this article solely reflects the author's opinion and does not represent the platform in any capacity. This article is not intended to serve as a reference for making investment decisions.
You may also like
Bitcoin 2022 bear market correlation hits 98% as ETFs add $220M

Fed rate-cut bets surge: Can Bitcoin finally break $91K to go higher?

Crypto: Fundraising Explodes by +150% in One Year