XRP price outlook: XRP is showing short-term weakness after a failed breakout at $2.8270; immediate support sits at $2.70 and the critical weekly level is $2.7280. A weekly close below $2.7280 would raise the probability of a decline toward $2.60–$2.70 within days.
-
Short-term support test: $2.70 — watch hourly momentum.
-
Weekly close at $2.7280 is the key pivot for medium-term direction.
-
XRP down 1.73% today and trading at $2.7772; monitor volume on TradingView and price indexes on CoinMarketCap.
XRP price outlook: Watch $2.7280 weekly close for direction; short-term support at $2.70. Read concise XRP price analysis and action points.
What is the XRP price outlook?
XRP price outlook shows early downside pressure after a failed breakout at $2.8270. In the short term, expect a possible test of $2.70; a weekly close below $2.7280 would increase risk of a slide toward the $2.60–$2.70 range. Monitor volume and candle closure for confirmation.
How is XRP/USD trading today?
Most of the coins are in the red zone on the first day of September, according to CoinMarketCap. XRP declined 1.73% over the last 24 hours and is trading at $2.7772 at press time. Hourly charts show the price retreating after a false breakout at the $2.8270 resistance level (TradingView observations). Low volume on the pullback would weaken the bearish case; rising sell volume would support further downside.
Technical notes:
- Hourly chart: Decline after failed breakout; potential $2.70 test by tomorrow if selling continues.
- Daily/Weekly view: No clear reversal signals; weekly candle close at $2.7280 is the critical pivot.
- Risk levels: Close below $2.7280 increases odds of $2.60 target; hold above supports consolidation.
Original market context and images are preserved below for visual reference.
Most of the coins are in the red zone on the first day of September, according to CoinMarketCap.
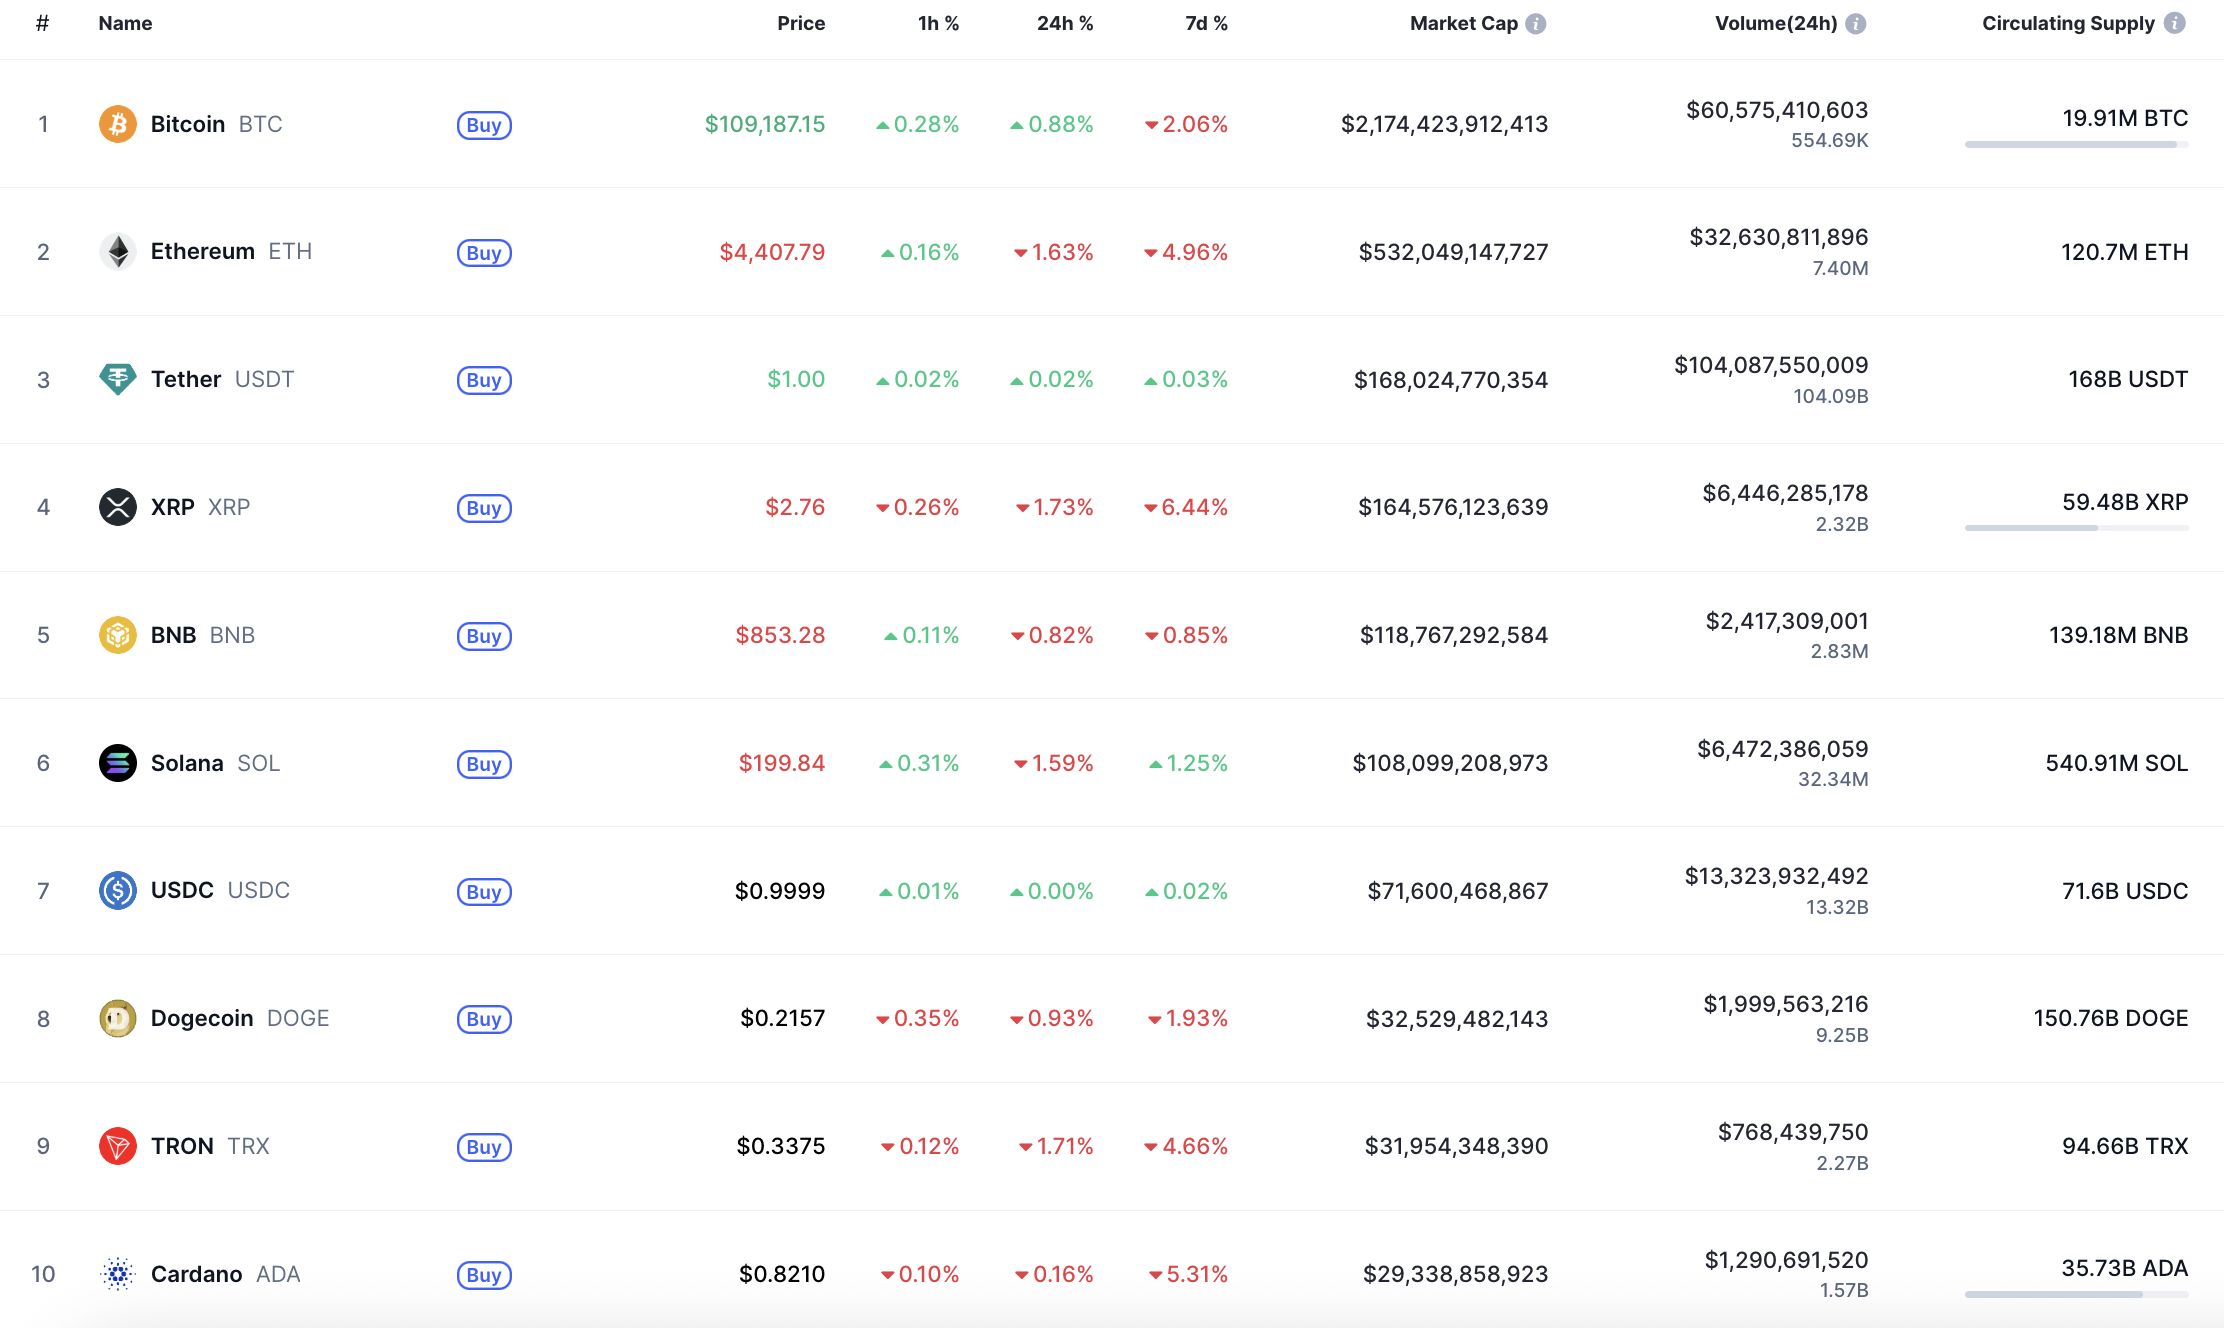
Top coins by CoinMarketCap
Why did XRP fail the breakout at $2.8270?
The breakout failed due to insufficient follow-through buying and renewed seller pressure at the local resistance of $2.8270. Order-book liquidity and short-term profit-taking near that level, visible on TradingView, contributed to the rejection. Without sustained volume above resistance, the move lacked confirmation.
XRP/USD
The rate of XRP has declined by 1.73% over the last day.
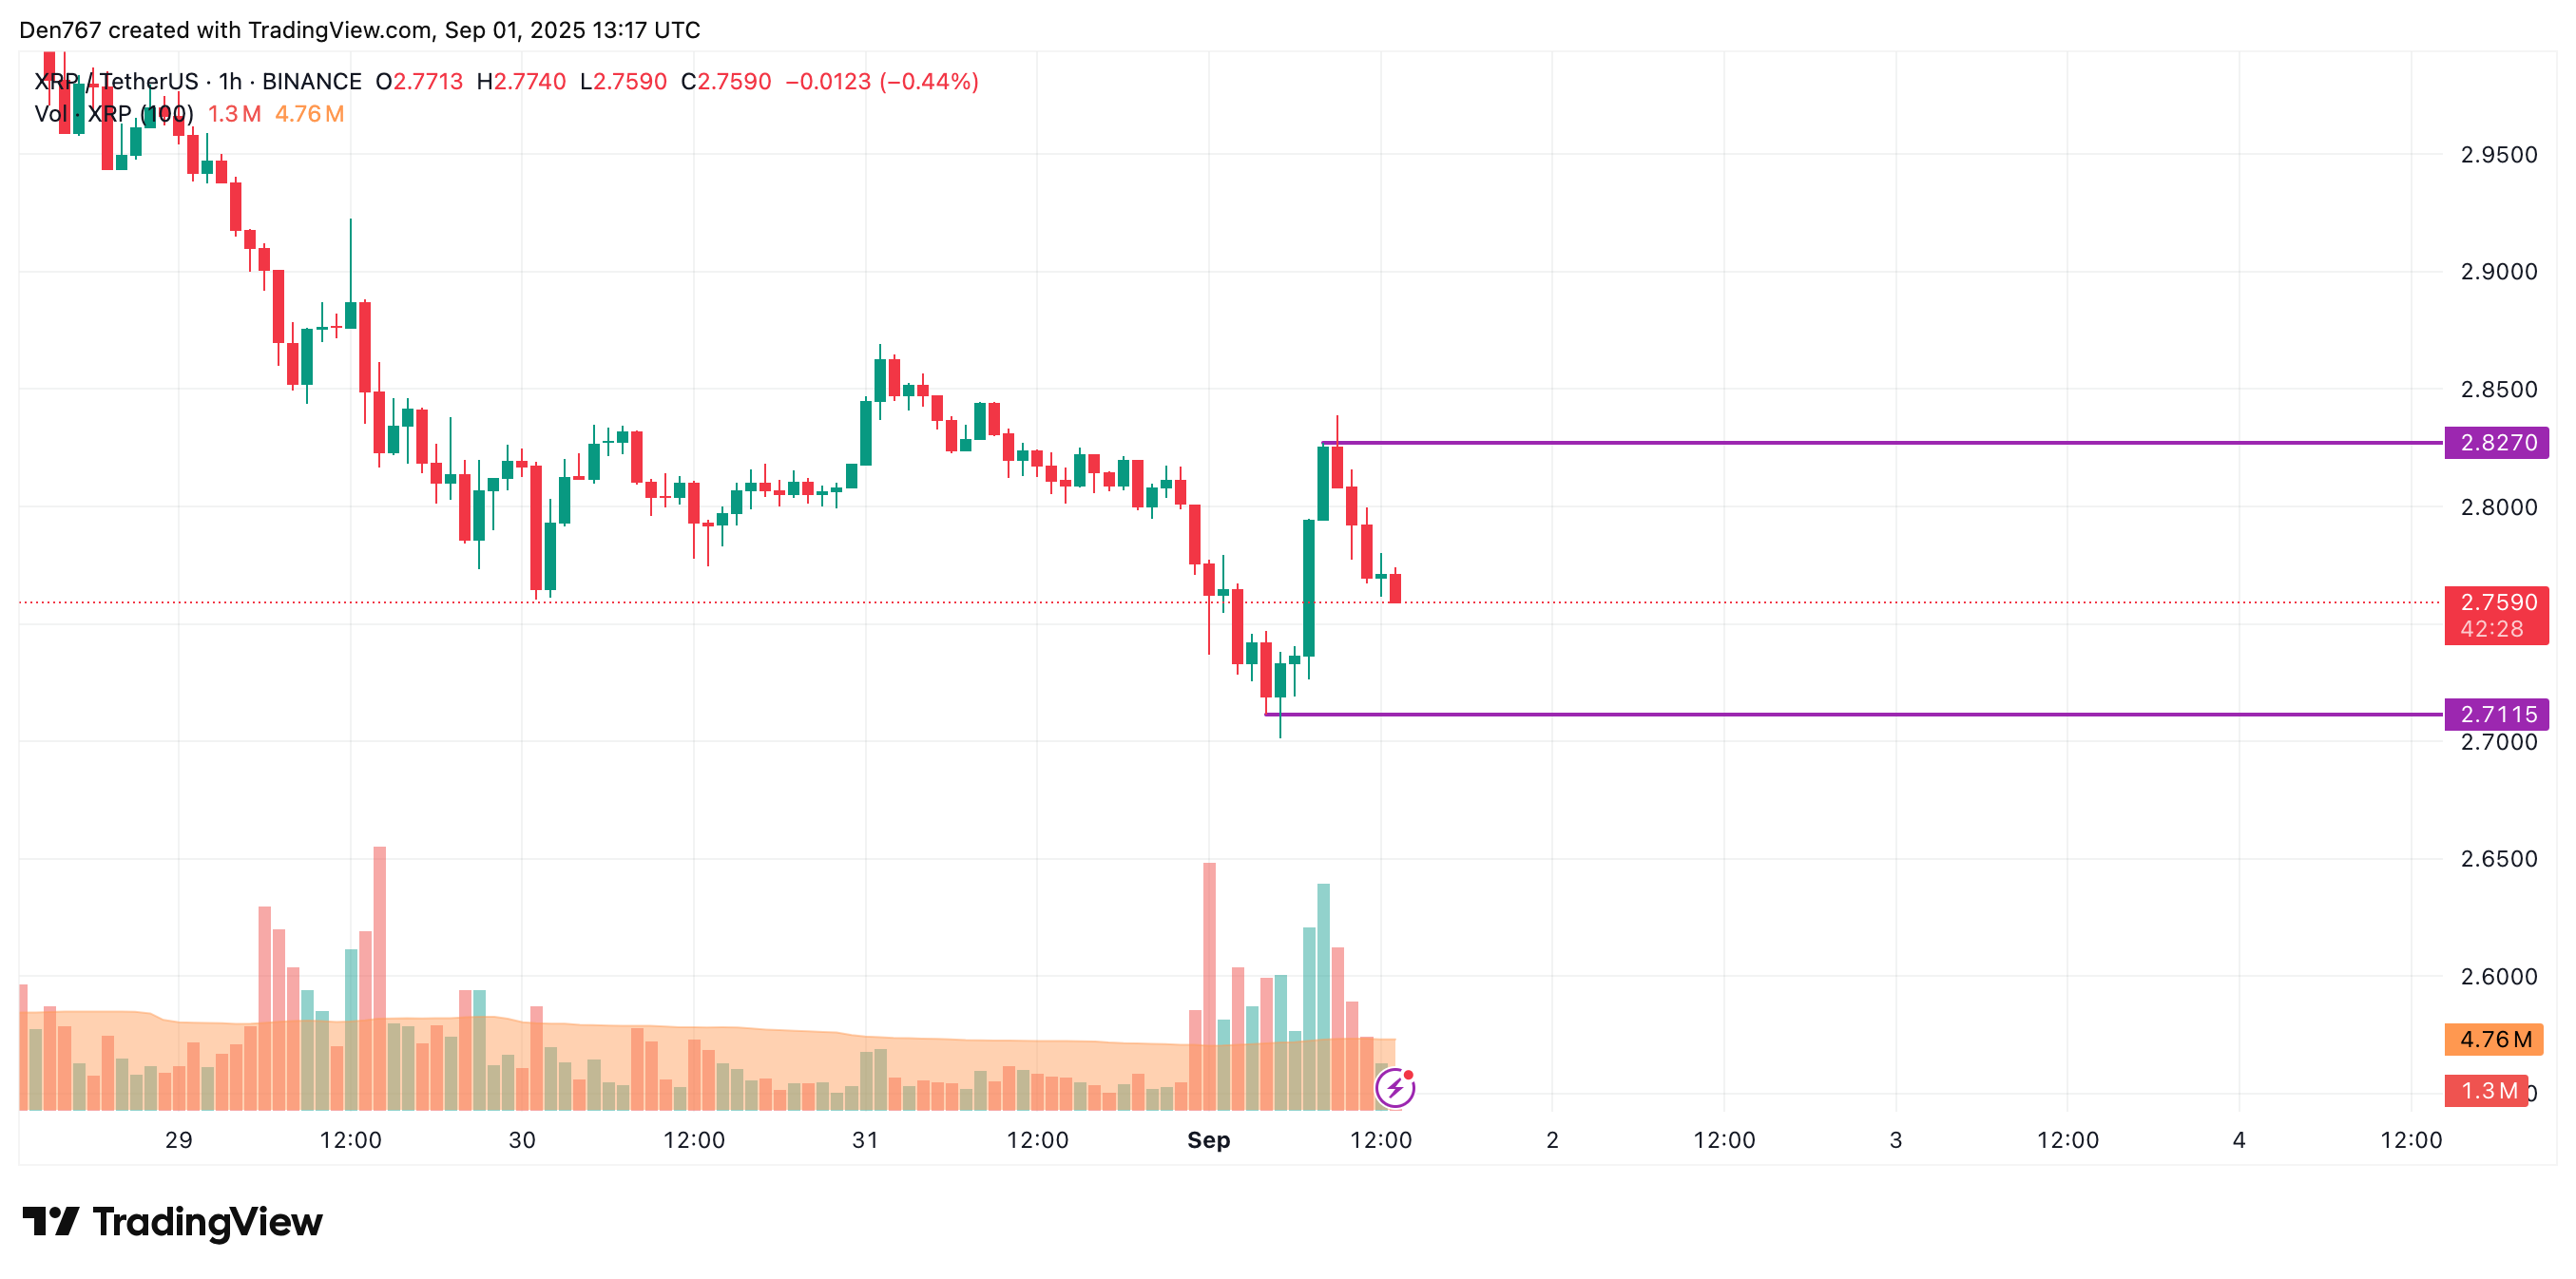
Image by TradingView
On the hourly chart, the price of XRP is going down after a false breakout of the local resistance of $2.8270. If sellers’ pressure continues, there is a chance of a test of $2.70 by tomorrow.
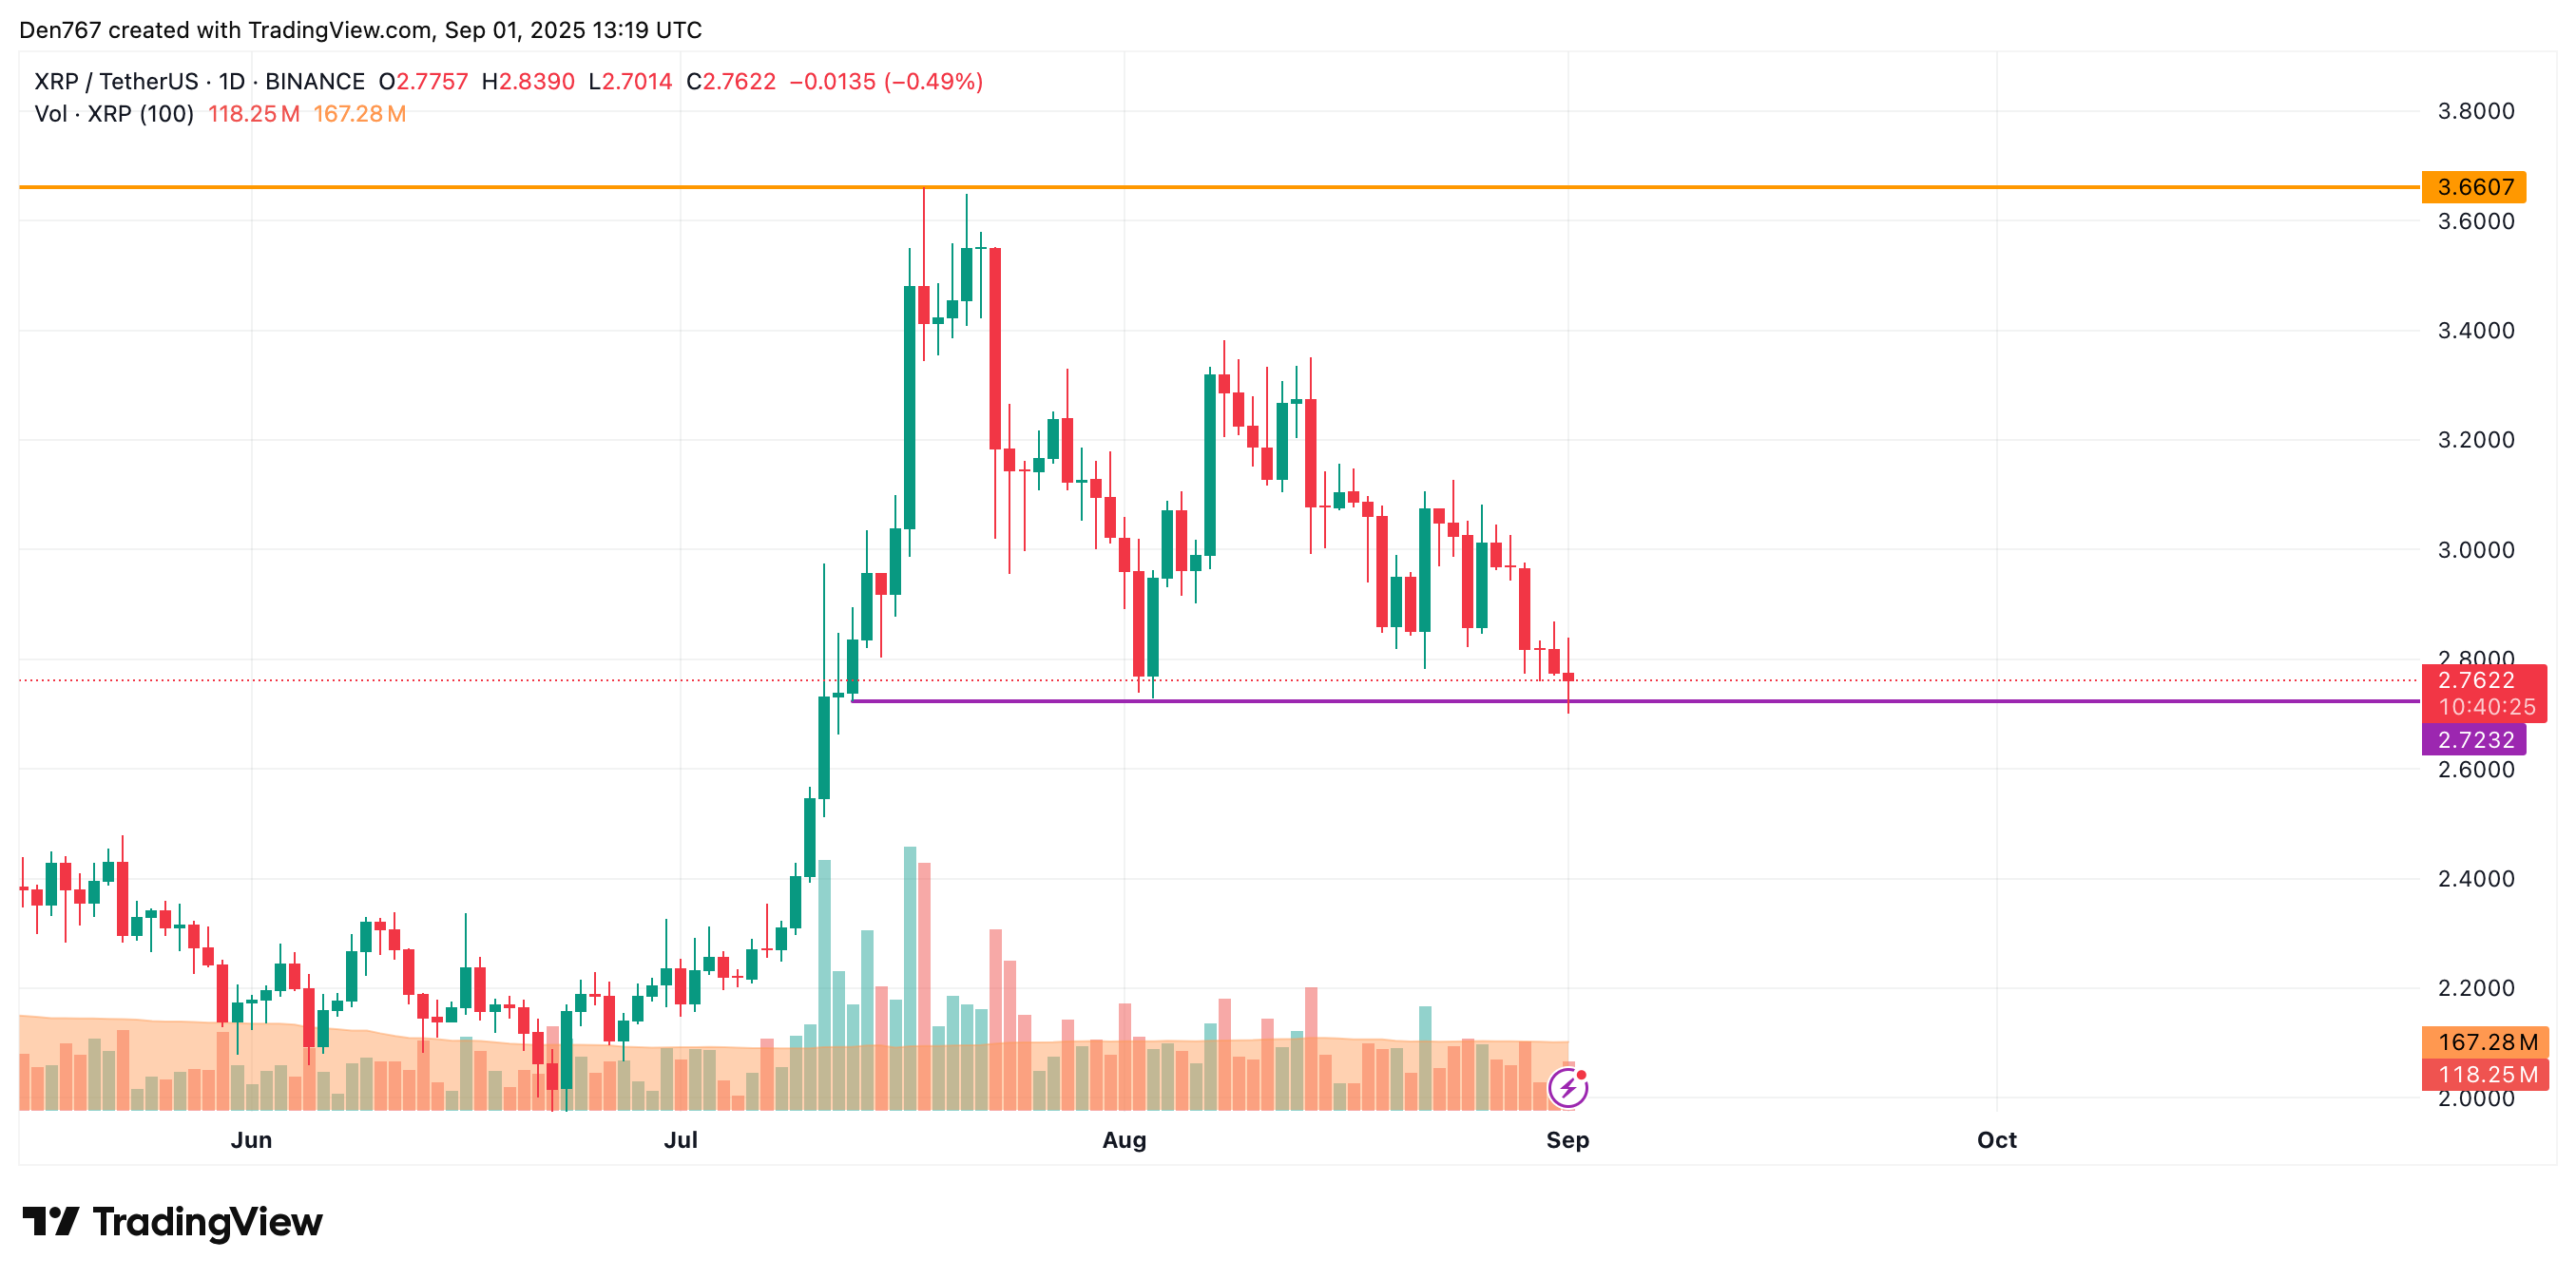
Image by TradingView
On the bigger time frame, there are no reversal signals yet. If a breakout of the support happens, the accumulated energy might be enough for a further decline to the $2.60 area.
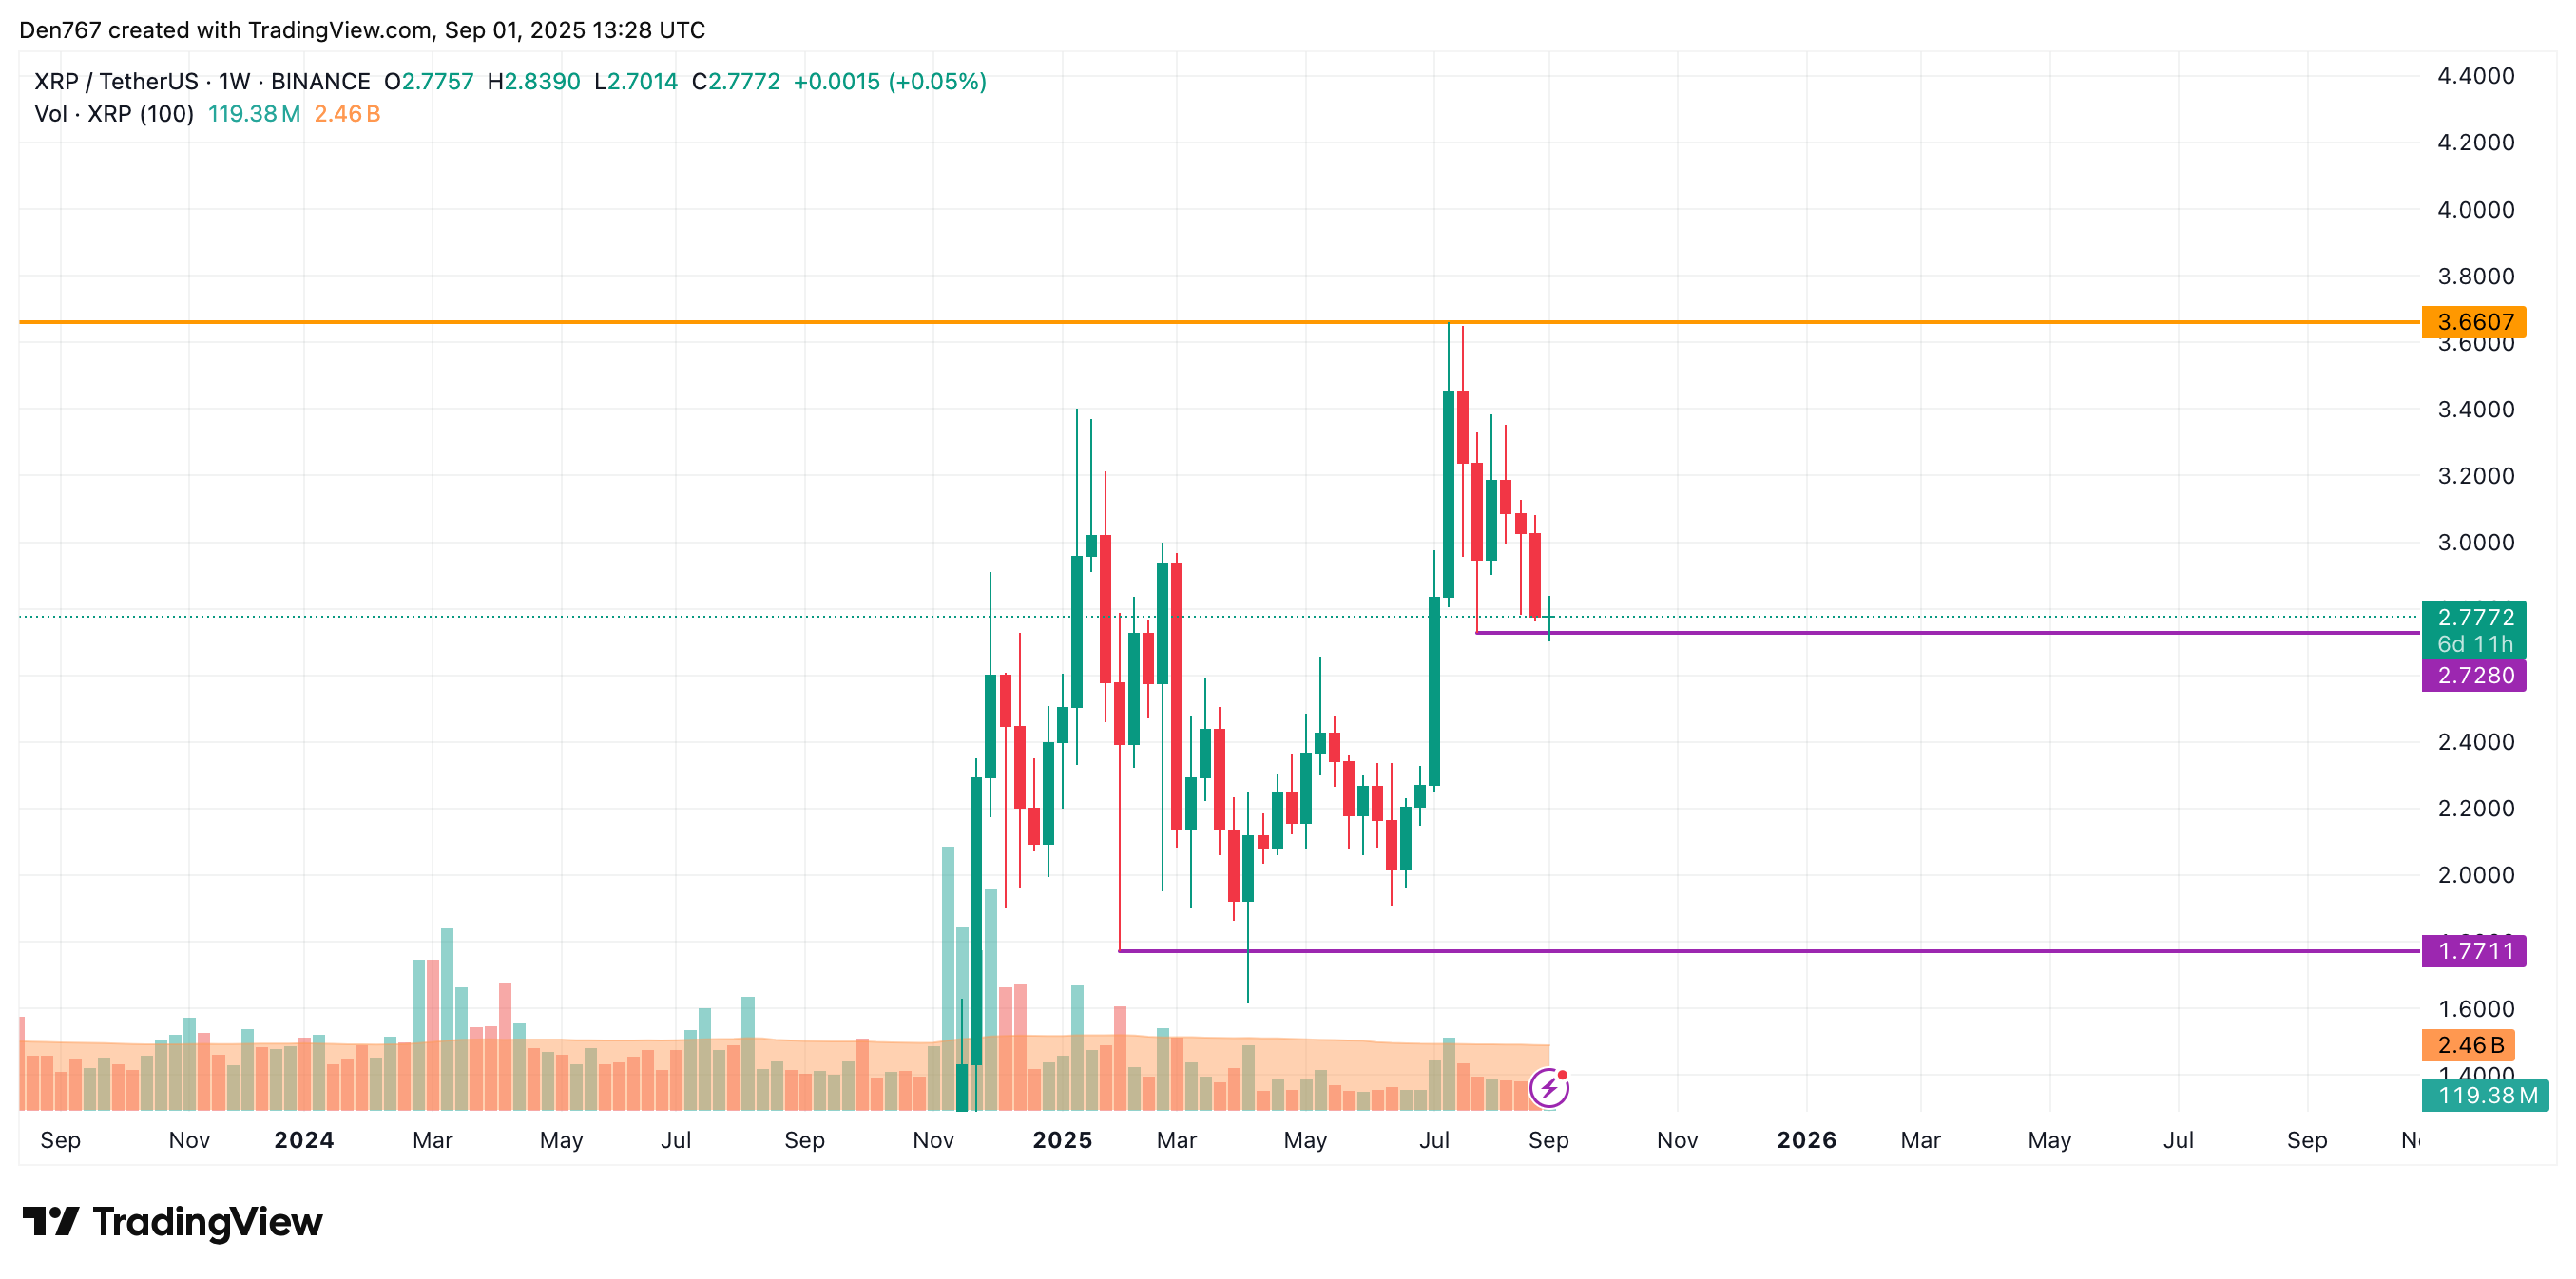
Image by TradingView
From the midterm point of view, one should focus on the weekly candle closure in terms of the $2.7280 level.
If the bar closes below that mark, traders may witness a test of the $2.60-$2.70 range soon.
XRP is trading at $2.7772 at press time.
Frequently Asked Questions
Will a weekly close below $2.7280 trigger a larger decline?
A weekly close below $2.7280 would increase the probability of a deeper decline toward $2.60–$2.70, assuming selling volume continues and no bullish reversal signals appear.
How can I use the $2.70 level in my trading plan?
Use $2.70 as an intraday support target for short-term longs and as a reference stop-loss area. If price breaks and holds below $2.70, consider reducing long exposure until the market stabilizes.
Key Takeaways
- Immediate risk: False breakout at $2.8270 suggests short-term downside pressure.
- Critical pivot: Weekly close at $2.7280 determines medium-term direction.
- Action: Monitor hourly momentum and volume; prepare for a possible $2.60–$2.70 test if weekly support fails.
Conclusion
The XRP price outlook remains cautiously bearish in the short term after a failed breakout at $2.8270. Traders should front-load decisions around the $2.7280 weekly close and watch $2.70 intraday support for trade management. COINOTAG will continue to monitor price action and volume for confirmed signals; review updates and risk controls before trading.