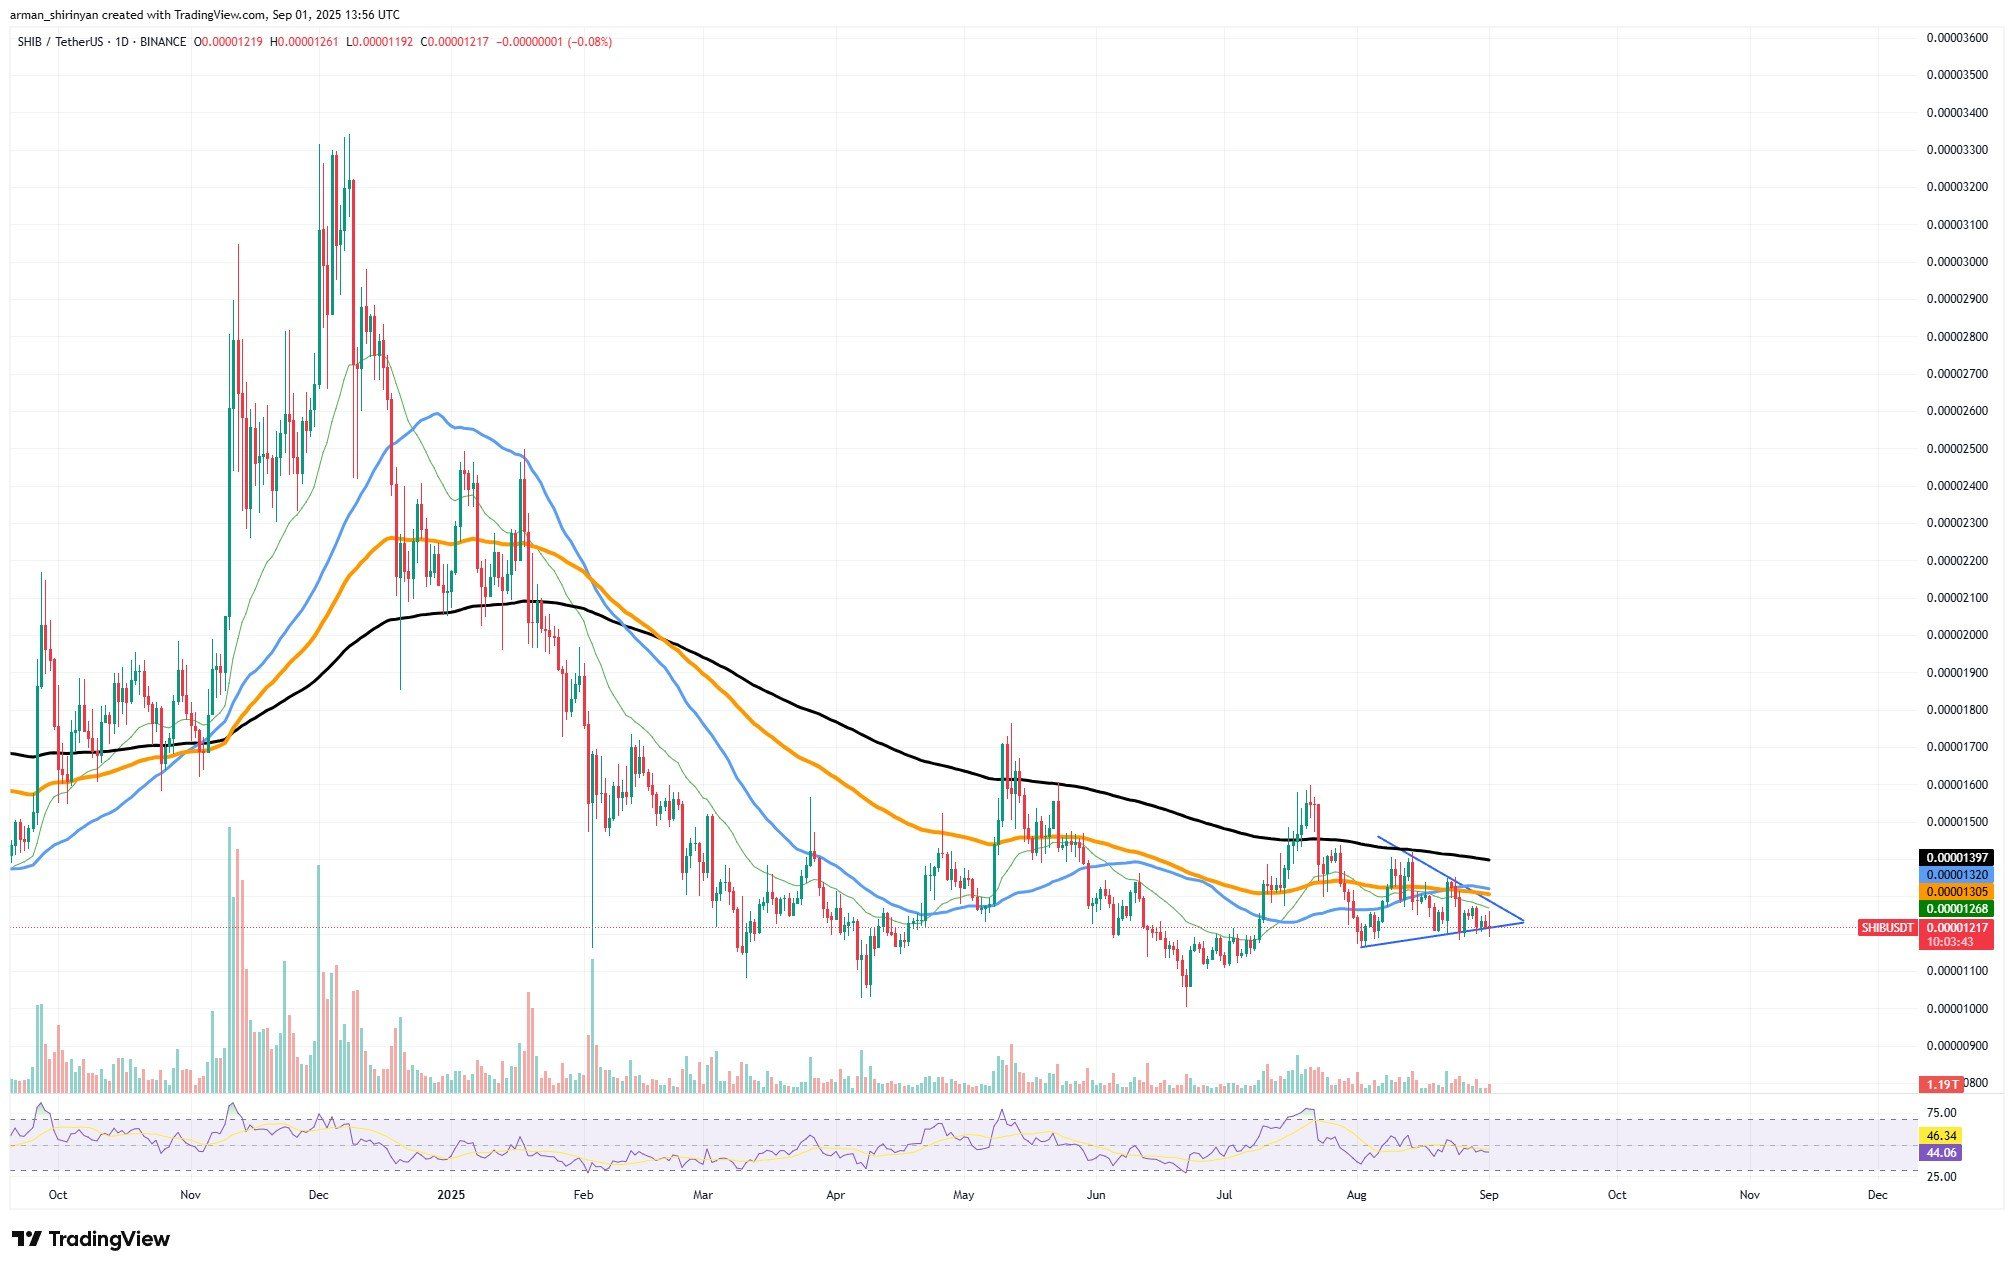
Shiba Inu price is compressing inside a symmetrical triangle around $0.0000123; a decisive breakout above $0.000013 or a breakdown below $0.00001 (and the 200-day EMA) will likely determine SHIB’s short-term trend and potential targets near $0.0000095 or $0.000015.
-
Symmetrical triangle compression: SHIB trading near $0.0000123, key levels at $0.00001 and $0.000013
-
Breakdown risks target $0.0000095; upside faces 200-day EMA resistance and $0.000015 zone
-
Watch volume spike on breakout and on-chain metrics from TradingView and exchange order books for confirmation
Shiba Inu price update: SHIB compresses in a triangle around $0.0000123 — watch $0.00001 support and $0.000013 resistance for the next move. Read analysis and trade levels.
What is happening with Shiba Inu price?
Shiba Inu price is consolidating inside a symmetrical triangle near $0.0000123, with converging support and resistance defining a short-term decision point. A decisive close below $0.00001 or above $0.000013 should provide a clear directional signal for traders and investors.

SHIB/USDT Chart by TradingView
Finally happening?
A confirmed breakdown below the triangle and under $0.00001 would increase downside momentum for SHIB. Technical models indicate the next support cluster near $0.0000095; extended weakness below that level would reinforce a bearish trend, particularly if the price remains below the 200-day moving average.
Conversely, a clean breakout above the upper trendline and a sustained move past $0.000013 would target the 200-day EMA and the $0.000015 zone as the next meaningful resistance. Confirmation requires rising volume and follow-through over multiple sessions.
Choosing direction
This inflection point places SHIB in a high-conviction setup: continued compression increases the likelihood of a strong volatility expansion. Watch intraday and daily volume for validation — a volume surge on breakout or breakdown typically signals institutional or retail conviction.
Key short-term scenarios to monitor:
- Bear case: Close below $0.00001 → target $0.0000095 → reassess risk if below 200-day MA.
- Bull case: Close above $0.000013 with rising volume → target $0.000015 and 200-day EMA resistance.
- Neutral case: Range-bound continuation inside the triangle → watch for false breakouts and volume divergence.
How should traders confirm a SHIB breakout or breakdown?
Use a combination of price closes beyond trendlines, daily volume above the 20-day average, and confirmation from order-book depth. Check TradingView chart patterns and exchange order flow data for entry and exit validation.
Frequently Asked Questions
What support and resistance should I watch for SHIB?
Watch support at $0.00001 and resistance at $0.000013; secondary targets include $0.0000095 on the downside and $0.000015/200-day EMA on the upside.
How likely is a volatility spike for SHIB?
A volatility spike is probable if the triangle resolves; compression historically precedes large moves, so monitor volume and order-book imbalances for early signals.
Key Takeaways
- Decision point: SHIB is compressed in a symmetrical triangle; expect a directional move once broken.
- Critical levels: $0.00001 (support), $0.000013 (resistance), $0.0000095 and $0.000015 as secondary targets.
- Confirmation: Use daily closes, volume spikes, and order-book data to validate breakouts or breakdowns before trading.
Conclusion
Shiba Inu price faces a pivotal moment as the symmetrical triangle tightens around $0.0000123. Traders should prioritize clear technical confirmation and volume-based validation before acting. COINOTAG will continue to monitor price action and on-chain indicators to report subsequent developments.


