Bitcoin Price Stabilizes – Is This the Start of a Comeback?

Bitcoin price is still showing bearish signs below $112,000. BTC is now attempting to recover and might face hurdles near the $110,500 level.
- Bitcoin started a fresh decline below the $112,000 zone.
- The price is trading below $110,500 and the 100 hourly Simple moving average.
- There was a break above a short-term contracting triangle with resistance at $108,800 on the hourly chart of the BTC/USD pair (data feed from Kraken).
- The pair might start another decline if it stays below the $110,500 zone.
Bitcoin Price Starts Consolidation
Bitcoin price attempted a fresh recovery wave from the $107,350 zone. BTC was able to climb above the $108,200 and $108,400 resistance levels.
The price cleared the 23.6% Fib retracement level of the key drop from the $113,457 swing high to the $107,352 low. Besides, there was a break above a short-term contracting triangle with resistance at $108,800 on the hourly chart of the BTC/USD pair.
However, the bears are still active near $109,500. The price is now consolidating near $109,500. Bitcoin is now trading below $110,000 and the 100 hourly Simple moving average.
Immediate resistance on the upside is near the $109,500 level. The first key resistance is near the $110,200 level. The next resistance could be $110,500 or the 50% Fib retracement level of the key drop from the $113,457 swing high to the $107,352 low.
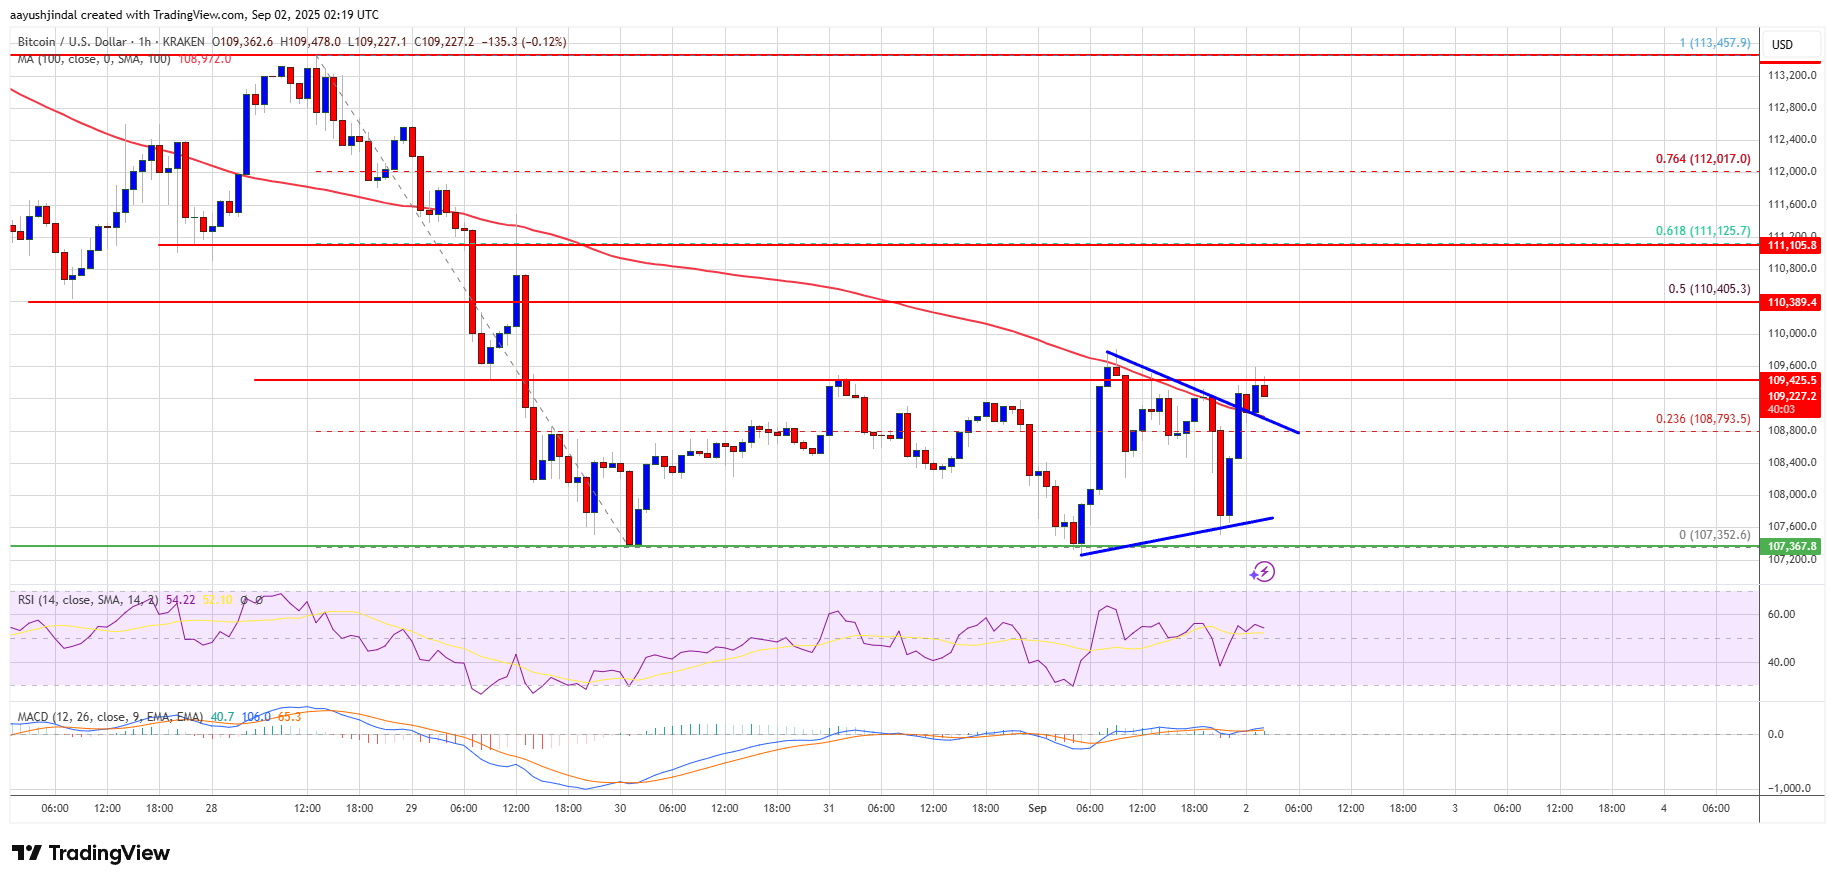
A close above the $110,500 resistance might send the price further higher. In the stated case, the price could rise and test the $111,650 resistance level. Any more gains might send the price toward the $112,500 level. The main target could be $113,500.
Another Decline In BTC?
If Bitcoin fails to rise above the $110,500 resistance zone, it could start a fresh decline. Immediate support is near the $108,800 level. The first major support is near the $108,200 level.
The next support is now near the $107,350 zone. Any more losses might send the price toward the $106,500 support in the near term. The main support sits at $105,500, below which BTC might decline sharply.
Technical indicators:
Hourly MACD – The MACD is now losing pace in the bearish zone.
Hourly RSI (Relative Strength Index) – The RSI for BTC/USD is now above the 50 level.
Major Support Levels – $108,800, followed by $108,000.
Major Resistance Levels – $109,500 and $110,500.
Disclaimer: The content of this article solely reflects the author's opinion and does not represent the platform in any capacity. This article is not intended to serve as a reference for making investment decisions.
You may also like
Did top universities also get burned? Harvard invested $500 million heavily in bitcoin right before the major plunge
Harvard University's endowment fund significantly increased its holdings in bitcoin ETFs to nearly 500 million USD in the previous quarter. However, in the current quarter, the price of bitcoin subsequently dropped by more than 20%, exposing the fund to significant timing risk.

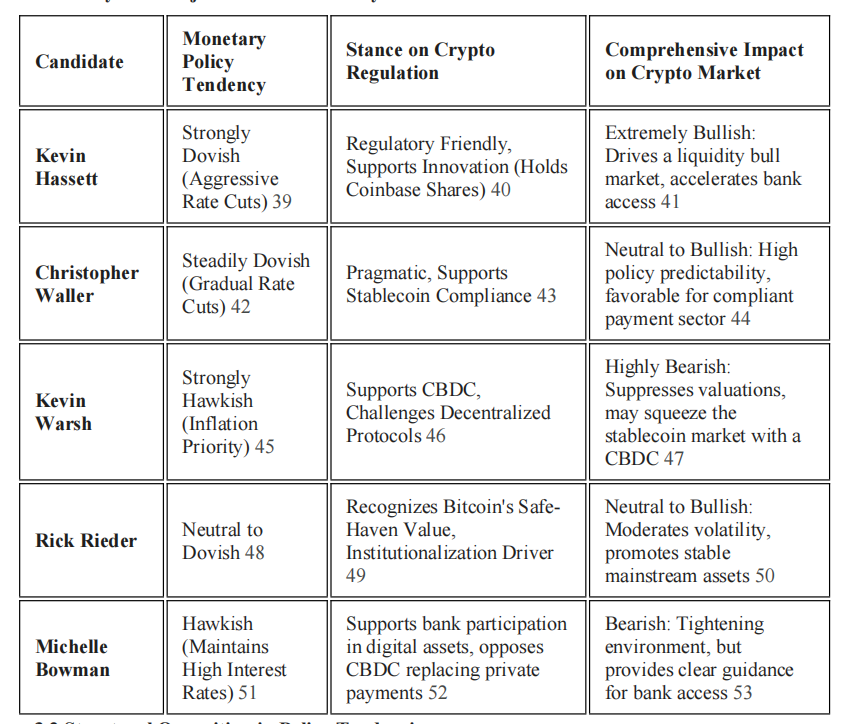
The Structural Impact of the Next Federal Reserve Chair on the Cryptocurrency Industry: Policy Shifts and Regulatory Reshaping
The change of the next Federal Reserve Chair is a decisive factor in reshaping the future macro environment of the cryptocurrency industry.
Tether: The Largest Yet Most Fragile Pillar in the Crypto World

In-depth Analysis of the Ethereum Fusaka Upgrade: Core Changes and Ecosystem Impact