Bitget App
Trade smarter
Buy cryptoMarketsTradeFuturesEarnWeb3SquareMore
Trade
Spot
Buy and sell crypto with ease
Margin
Amplify your capital and maximize fund efficiency
Onchain
Going Onchain, without going Onchain!
Convert & block trade
Convert crypto with one click and zero fees
Explore
Launchhub
Gain the edge early and start winning
Copy
Copy elite trader with one click
Bots
Simple, fast, and reliable AI trading bot
Trade
USDT-M Futures
Futures settled in USDT
USDC-M Futures
Futures settled in USDC
Coin-M Futures
Futures settled in cryptocurrencies
Explore
Futures guide
A beginner-to-advanced journey in futures trading
Futures promotions
Generous rewards await
Overview
A variety of products to grow your assets
Simple Earn
Deposit and withdraw anytime to earn flexible returns with zero risk
On-chain Earn
Earn profits daily without risking principal
Structured Earn
Robust financial innovation to navigate market swings
VIP and Wealth Management
Premium services for smart wealth management
Loans
Flexible borrowing with high fund security
Render (RENDER) To Dip Further Before a Potential Bounce Back? Key Pattern Formation Suggests So

Render (RENDER) To Dip Further Before a Potential Bounce Back? Key Pattern Formation Suggests So

CoinsProbeCoinsProbe2025/09/06 13:35
By:Nilesh Hembade

Date: Sat, Sept 06, 2025 | 11:10 AM GMT

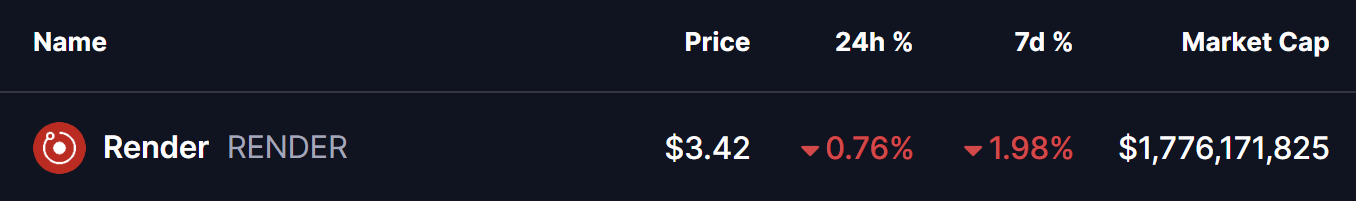
The cryptocurrency market is continuing its choppy consolidation as Ethereum (ETH) hovers around $4,300, cooling off from its recent high of $4,954 — a drop of more than 13% in just weeks. This weakness has spilled over into major altcoins including Render (RENDER).

RENDER is trading in the red, and more importantly, its current chart structure reveals a familiar price behavior, which may offer clues about what’s next.

Render (RENDER) To Dip Further Before a Potential Bounce Back? Key Pattern Formation Suggests So image 0 Source: Coinmarketcap

Familiar Pattern Hints at Further Dip

On the daily chart, RENDER continues to trade within a falling wedge formation — a structure that often resolves bullishly over the long run. However, in the short term, price action suggests more downside before any potential recovery.

In June, RENDER lost its grip on the 100-day moving average (100 MA) and quickly dropped by around 34%, bottoming out near the wedge’s lower support at $2.75.

Render (RENDER) To Dip Further Before a Potential Bounce Back? Key Pattern Formation Suggests So image 1 
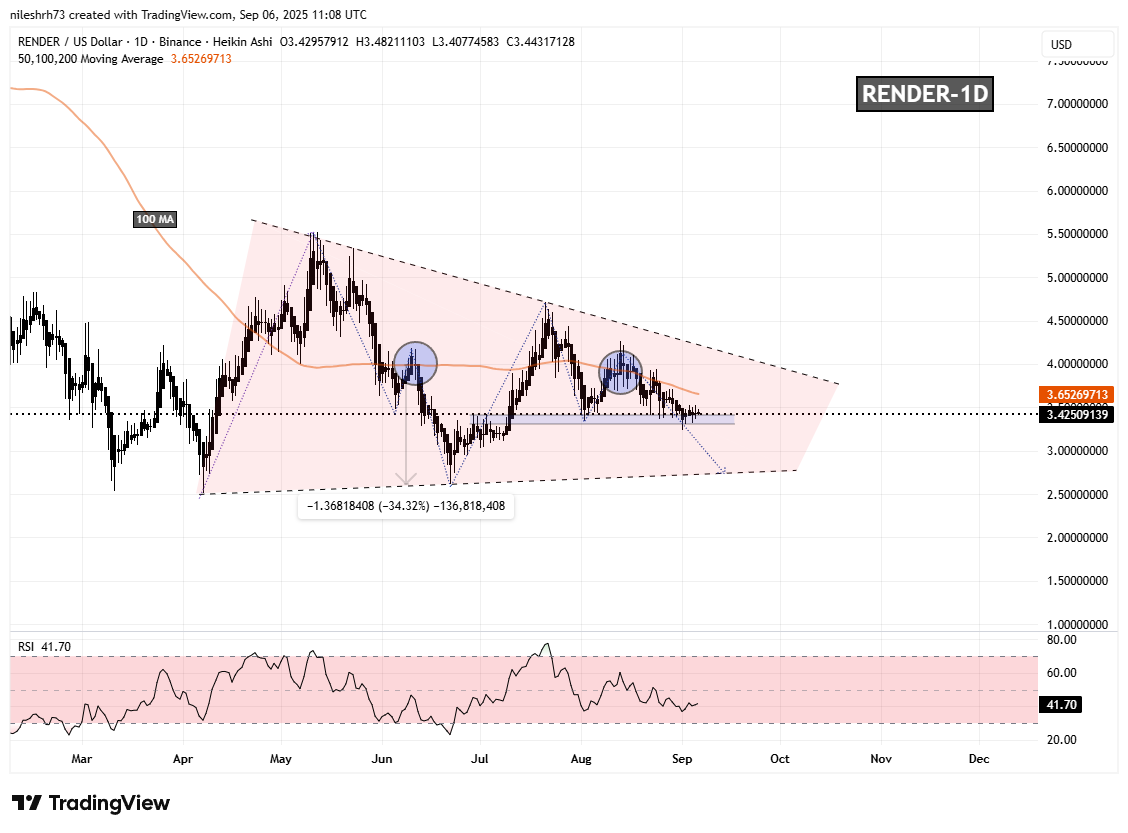
Render (RENDER) Daily Chart/Coinsprobe (Source: Tradingview)

Fast forward to now, and history appears to be repeating itself. RENDER has once again slipped below its 100-day MA near $3.91, and is now hovering around the critical support area of $3.30–$3.40.

What’s Next for RENDER?

If the same fractal continues, RENDER risks another correction toward the lower wedge boundary around $2.75, which would mark a potential 19% decline from current levels. Adding to this bearish case, the Relative Strength Index (RSI) is sitting near 41, leaving room for further downside into the oversold region before a rebound attempt.

However, if RENDER manages to reclaim its 100-day MA ($3.65), this bearish setup would likely be invalidated, opening the door for a recovery move instead.

0

Disclaimer: The content of this article solely reflects the author's opinion and does not represent the platform in any capacity. This article is not intended to serve as a reference for making investment decisions.

PoolX: Earn new token airdrops
Lock your assets and earn 10%+ APR
Lock now!

You may also like

A $500 billion valuation giant is emerging

With a valuation comparable to OpenAI and surpassing SpaceX and ByteDance, Tether has attracted significant attention.

ForesightNews2025/11/06 06:05
A $500 billion valuation giant is emerging

Prediction markets meet Tinder: Can you place bets on Warden's new product by simply swiping left or right?

No need for chart analysis, macro research, or even inputting the amount of funds.

ForesightNews 速递2025/11/06 05:13
Prediction markets meet Tinder: Can you place bets on Warden's new product by simply swiping left or right?

Why does bitcoin only rise when the U.S. government reopens?

The US government shutdown has entered its 36th day, leading to a decline in global financial markets. The shutdown has prevented funds from being released from the Treasury General Account (TGA), draining market liquidity and triggering a liquidity crisis. Interbank lending rates have soared, while default rates on commercial real estate and auto loans have risen, increasing systemic risk. The market is divided over future trends: pessimists believe the liquidity shock will persist, while optimists expect a liquidity release after the shutdown ends. Summary generated by Mars AI. The accuracy and completeness of this summary are still being improved as the Mars AI model is updated.

MarsBit2025/11/06 05:03
Why does bitcoin only rise when the U.S. government reopens?

Jensen Huang predicts: China will surpass the United States in the AI race

Nvidia CEO Jensen Huang stated bluntly that, thanks to advantages in electricity prices and regulation, China will win the AI race. He added that overly cautious and conservative regulation in Western countries such as the UK and the US will "hold them back."

Jin102025/11/06 04:59