

Solana price has retested the $233.8 resistance after a recovery from $8.50 lows, signaling renewed bullish momentum; a firm hold above $233.8 puts the next breakout target near $457–498, according to technical patterns and analyst projections.
-
Solana retests $233.8 resistance, confirming a potential breakout setup.
-
Analyst targets cluster near $457–$498 if price secures above $233.8.
-
Recovery from $8.50 lows represents ~95% decline and strong cyclical rebound.
Solana price retests $233.8 resistance after recovery from $8.50; read analyst targets and technical outlook to assess the next breakout opportunity.
What is driving Solana price to retest $233.8?
Solana price is retesting the $233.8 resistance after a multi-year recovery that started from $8.50, with technicals showing higher highs and a broken descending trendline. Traders watching a sustained hold above $233.8 are eyeing upside targets in the $457–$498 range.
How did Solana recover from the $8.50 lows?
Solana’s recovery followed a deep bear phase that erased roughly 95% of its value. The turnaround began in early 2023 when SOL reclaimed key resistance zones, formed a consolidation band, then broke out in late 2024 toward the 225–234 region. Analyst Javon Marks highlighted a confirmed bull pattern from $129 that supports targets near $457.97. Volume data remains limited, so price action is the primary guide.
Solana retests $233.8 resistance after rebounding from $8.50 lows with analysts eyeing $457 as the next breakout target ahead.
- Solana rebounds from a brutal 95 percent crash and now retests $233.8 with $457 in sight showing powerful recovery momentum.
- After years of decline Solana breaks its downtrend forms higher highs and signals renewed strength with upside targets near $497.
- Solana’s climb from $8.50 lows to $233.8 proves patience pays off as technicals now point toward another breakout phase.
Solana’s rally has reignited market optimism as the asset retests its $233.8 resistance, opening the door for another major breakout. Analyst Javon Marks noted that a confirmed bull pattern from $129 places $457.97 firmly in sight. The rapid climb shows how SOL has shifted from prolonged weakness to renewed strength.
Why does the technical picture support further upside?
The descending trendline that defined Solana’s bear market has been broken, and price has produced a sequence of higher highs and higher lows. This is textbook bullish structure. Short-term traders will watch whether Solana secures a daily close above $233.80; a confirmed close increases the probability of retesting the $457–$498 resistance zone.
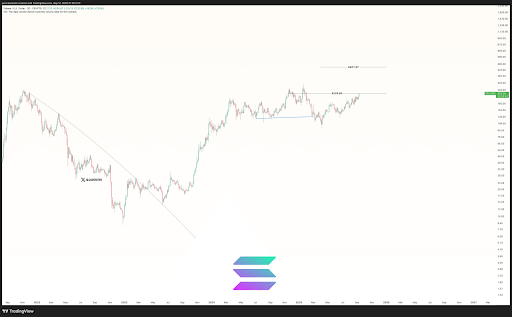
Source: Javon Marks
When should traders adjust risk around $233.8?
Traders should consider tightened risk management if Solana fails to hold above $233.80 on a daily close. A rejection could push price back toward the consolidation band between $100–$180. Conversely, a decisive breakout on increased momentum would shift targets toward $457 and $497.87.
How to watch for a confirmed breakout (step-by-step)
Follow these steps to track breakout probability:
- Confirm a daily close above $233.80 with follow-through price action.
- Monitor volume for expansion; higher volume supports sustainable momentum.
- Watch key support at prior breakout levels (around $129 and $150).
- Set staged profit targets near $457 and $497, and use trailing stops on gains.
Frequently Asked Questions
Will Solana reach $497 after this breakout?
Reaching $497 is possible if Solana sustains momentum after clearing $233.80 and posts expanding volume. Traders should treat $457 as the nearer practical target and $497 as a secondary objective contingent on strong follow-through.
How should I position for short-term trades on Solana?
For short-term trading, use a daily close above $233.80 as confirmation, employ stop-losses below recent support (e.g., $129–$150), and scale entries to manage risk. Prioritize price action and volume over single indicator signals.
Key Takeaways
- Retest confirmed: Solana is testing $233.8 resistance after recovering from $8.50.
- Targets: Primary upside levels are $457 and $497 if momentum holds.
- Action: Watch for a daily close above $233.80 and volume expansion before adding exposure.
Conclusion
Solana’s price recovery from $8.50 to a $233.8 retest demonstrates a meaningful shift in market structure, with technicals and analyst commentary pointing to upside targets near $457–$498. Traders should prioritize confirmation via price and volume, maintain disciplined risk management, and monitor key support levels as the breakout narrative develops.