Date: Fri, Sept 12, 2025 | 02:52 PM GMT
The cryptocurrency market continues to show strength amid the anticipated potential US Federal Reserve rate cuts, with Ethereum (ETH) reclaiming the $4,500 mark. Following this, several major altcoins are flashing bullish signals — including Polkadot (DOT).
DOT has turned green with a 10% gain over the past week, and more importantly, its price chart is displaying a key harmonic structure that could be pointing to a larger upside move in the near term.
 Source: Coinmarketcap
Harmonic Pattern Hints at Potential Upside
On the daily chart, DOT has formed a Bearish Butterfly harmonic pattern. Despite its bearish label, this setup often shows a bullish continuation during the CD leg, as price drives toward the Potential Reversal Zone (PRZ).
The pattern began at Point X ($4.673), dropped to Point A, rallied to Point B, and retraced to Point C near $3.612. From that point, DOT regained strength and is now trading around $4.21, showing resilience and steady accumulation.
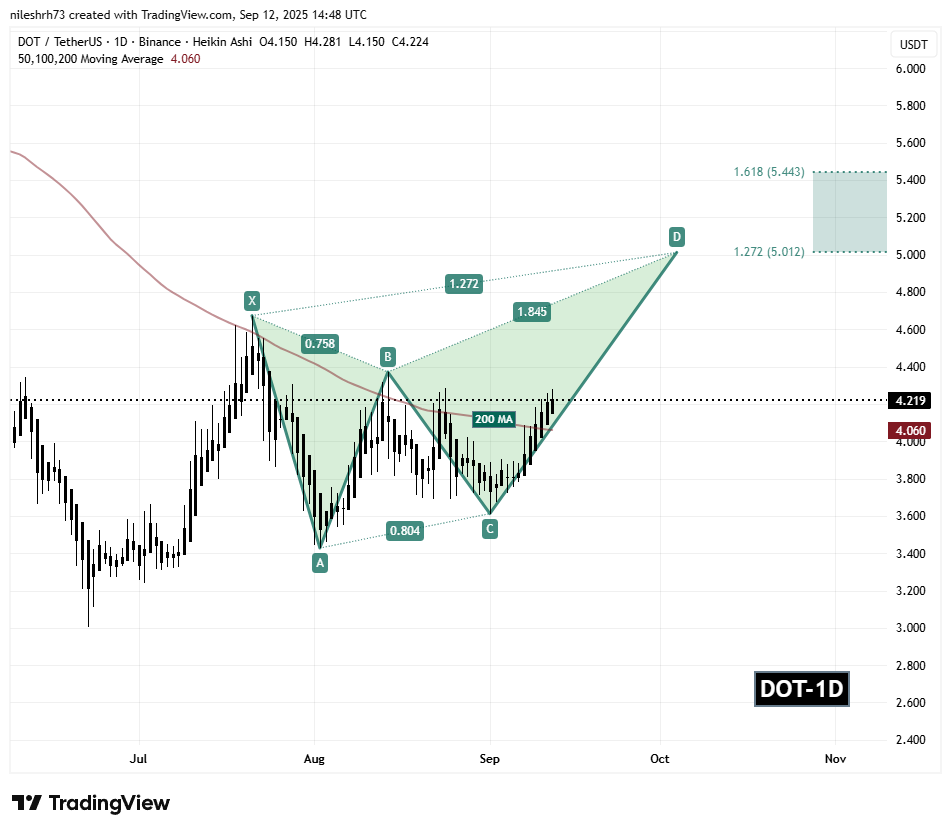 Polkadot (DOT) Daily Chart/Coinsprobe (Source: Tradingview)
A key development is DOT’s successful reclaim of the 200-day moving average ($4.06), which now acts as strong support — further reinforcing the bullish case.
What’s Next for DOT?
If buyers hold above the 200-day MA, DOT could climb toward the PRZ zone between $5.012 (1.272 Fib extension) and $5.443 (1.618 Fib extension). These levels mark the potential completion of the Butterfly pattern and serve as the next technical upside targets.
With momentum building and bullish structure intact, traders will be watching closely to see if DOT can sustain its breakout trajectory and confirm this harmonic-driven rally.