
BTC Weekly Watch: Bearish Sniper Battle!

1. Weekly Market Review: (09.15~09.21)
This week opened at 115,316 points, hit the lowest point of 114,421 on Monday, reached the highest point of 117,968 on Thursday, and finally closed at 115,292 points. The weekly decline was 0.04%, with a maximum amplitude of 0.31%, and a trading volume of $8.21 billions. This week formed a bearish "doji star" candlestick, with the price closing near the 10-week moving average.
Bitcoin weekly candlestick chart: (Momentum Quantitative Model + Sentiment Quantitative Model)
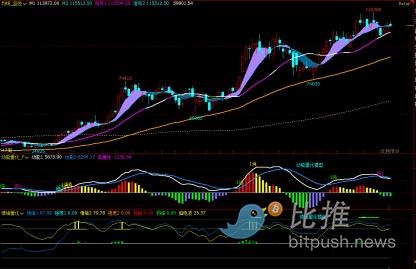
Figure 1
Bitcoin daily candlestick chart:
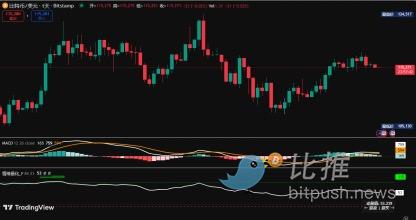
Figure 2
Bitcoin 4-hour candlestick chart:
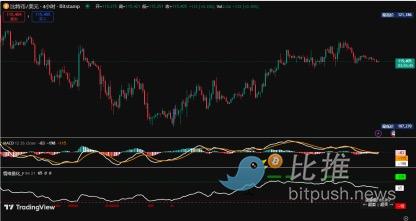
Figure 3
In the weekly review on September 14, the author predicted:
1. Bitcoin has entered a bearish market on both weekly and daily levels, and the subsequent trend should focus on shorting on rallies.
2. The author predicted that bitcoin would have a small rebound this week or even reach a new high, but it is already at the end of the rebound, with little time and space left. After the rebound ends, it will return to a volatile downward trend.
3. Resistance levels: The first resistance is around 117,800 points, and strong resistance is around 119,300 points.
4. Support levels: The first support is around 113,500 points, the second support is around 105,300~107,000 points, and strong support is around 98,000~100,500 points.
The trading strategy given in the last weekly review was:
1. It is recommended that investors mainly observe before the Federal Reserve interest rate meeting, and make decisions after the market calms down in the second half of the week.
2. Medium-term position: Currently, a 30% short position has been established.
2. Short-term position: Set stop-loss points and focus on shorting on rallies. (Using 1-hour as the trading cycle)
Hold a small amount of short positions bought near 113,500 points, and close them at an appropriate time next week.
Review of actual market movements this week:
On Monday, bitcoin opened at 115,316 points and fluctuated around this level throughout the day with little amplitude, touching the week's low of 114,421 points and forming a bullish "doji star" candlestick with a 0.04% increase;
On Tuesday, the price rose after opening, with the increase expanding throughout the day, closing with a 1.26% gain;
On Wednesday, stimulated by the positive news of an interest rate cut, the price experienced significant volatility, with a maximum amplitude of 2,576 points, and closed with a 0.31% decline and a long lower shadow "T-shaped" bearish candlestick. Trading volume was significantly higher than the previous day;
On Thursday, the price rose after opening, reaching the week's and the current rebound's highest point of 117,968 points before slowly falling back, closing with a small bullish candlestick with a 0.56% gain.
On Friday, the price fell after opening, with little resistance from the bulls during the adjustment, and finally closed with a 1.21% decline, erasing all the gains of the previous four days.
On Saturday, the market was dominated by a wait-and-see attitude, with very little price fluctuation, a maximum amplitude of only 718 points, and a small "doji star" candlestick for the day.
On Sunday, the price adjusted slightly, trading volume shrank compared to the previous day, and closed with a small bearish candlestick with a 0.40% decline.
Judging from the actual price movement, this week closed with a small bearish "doji star" candlestick with a 0.04% decline, and set a new high of 117,968 points since the rebound started on September 1. This trend confirms the author's view from last week, and the week's high of 117,968 points is only 168 points away from the predicted resistance of 117,800 points.
Next, the author will analyze the internal structural changes of bitcoin after this week's movement based on multi-dimensional technical indicators.
1. As shown in Figure 1, from the weekly chart:
① Momentum Quantitative Model: The weekly level is in a momentum top divergence process. After this week's movement, the volume (green) bar has increased compared to last week.
The model indicates a high probability of price decline.
② Sentiment Quantitative Model: Both sentiment indicators are at 0, with a peak value of 0.
The model suggests the price is in a correction process.
③ Digital Monitoring Model: No digital signals are currently displayed.
The above data indicate: The weekly level is at the early stage of a decline.
2. As shown in Figure 2, from the daily chart analysis:
① Momentum Quantitative Model: Although the price has rebounded continuously, both momentum lines have returned to near the zero axis, but line 1 has started to turn downward, and the energy (red) bar has gradually shortened for five consecutive days.
② Sentiment Quantitative Model: After the close on Sunday, both sentiment indicators are near 50.
The above data indicate: The daily-level rebound is nearing its end.
2. Next Week's Market Forecast: (09.22~09.28)
1. At the weekly level, bitcoin is currently in a bearish market. At the daily level, observe the support function of the 113,500~114,500 point area. If the support is effective, the market will continue to fluctuate; if it is effectively broken, it indicates the end of this technical rebound and the price will return to a volatile downward trend.
2. Resistance levels: The first resistance is around 118,000 points, and strong resistance is around 119,300 points.
3. Support levels: The first support is around 113,500~114,500 points, the second support is around 105,300~107,000 points, and strong support is around 98,000~100,500 points.
3. Next Week's Trading Strategy (excluding the impact of unexpected news): (09.22~09.28)
1. The main strategy for next week is to short on rallies.
2. Medium-term position: Currently, a 75% short position has been established. For the next position-building strategy, please refer to the link at the bottom of the article.
2. Short-term position: Set stop-loss points and focus on shorting on rallies. (Using 1-hour as the trading cycle)
① Hold a small amount of short positions bought near 113,500 points and the short positions added this week, with an initial stop-loss set at 119,500 points.
② Reduce short positions when a stop-decline signal appears near the second support level.
3. Special reminder: For short-term trading, whether buying long or short positions, set the initial stop-loss immediately after opening a position. When the price gains 1%, immediately move the stop-loss to the cost line (i.e., the break-even point) to ensure that the trade will not lose money; when the profit reaches 2%, raise the stop-loss to the 1% profit level. Thereafter, every time the profit increases by 1%, the stop-loss should be raised by the same amount to dynamically protect realized profits.
Author: Cody Feng
Disclaimer: The content of this article solely reflects the author's opinion and does not represent the platform in any capacity. This article is not intended to serve as a reference for making investment decisions.
You may also like
MiCA regulation poorly applied within the EU, ESMA ready to take back control

$674M Into Solana ETF Despite Market Downturn

Here’s What Could Happen if XRP ETFs Reach $10 Billion