- PENGU trades at $0.03388 after a 24h gain of 8.2%, with resistance at $0.03394 and support at $0.02947.
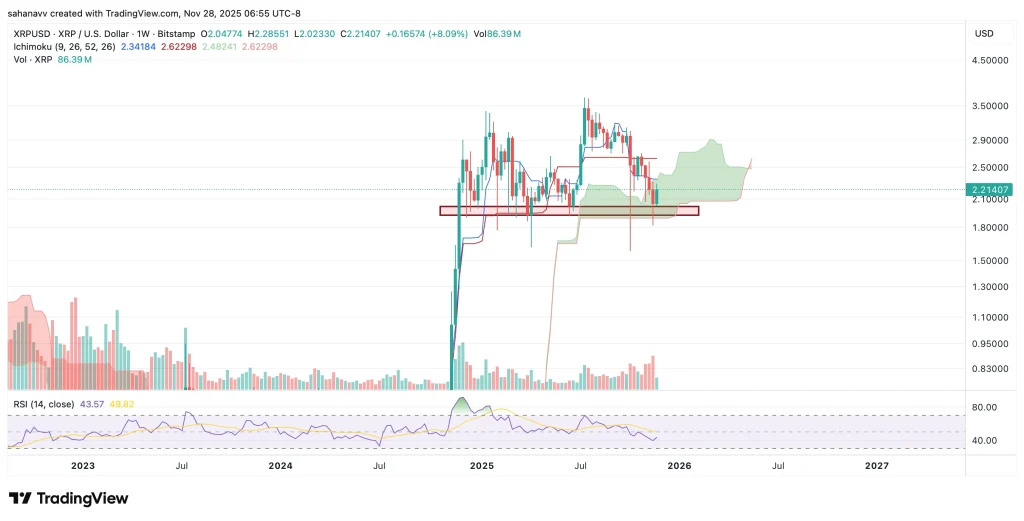
- Weekly chart shows consolidation following a strong green candle, highlighting potential bullish engulfing structure.
- PENGU gained 6.6% against Bitcoin, trading at 0.062724 BTC, outperforming broader market assets over the same period.
Pudgy Penguins’ token, PENGU, has maintained upward momentum, currently priced at $0.03388 after gaining 8.2% over the last 24 hours. The market range has tightened, with resistance capped at $0.03394 and support established at $0.02947. This places the token in a consolidation phase while technical data highlights significant developments on the weekly chart.
Weekly Price Action Highlights Consolidation
The weekly timeframe shows notable volatility, with recent candles reflecting consolidation after earlier gains. The chart displays a formation similar to previous consolidation phases seen earlier this year. At that time, the token compressed into a tighter band before advancing.
Currently, the weekly structure highlights a pullback phase within a larger bullish context. Price action has produced alternating candles inside the $0.02947 to $0.03394 range. This consolidation follows a strong green candle, which indicates renewed buying activity. The presence of this large candle has shifted attention toward the upper boundaries of the current trading zone.
Short-Term Levels Remain Crucial
On the daily performance scale, the price increase of 8.2% brings the token into focus against major assets. Against Bitcoin, PENGU trades at 0.062724 BTC, a gain of 6.6%. These figures show that the token has recorded stronger movement compared to the broader market within the same period.
However, traders remain cautious of the immediate support and resistance levels. The support at $0.02947 has so far limited downside movement, while resistance at $0.03394 has restricted upward momentum. This narrow band represents the immediate trading framework, with participants closely monitoring a potential expansion outside these boundaries.
Technical Structure Suggests Market Watch Ahead
The weekly candle pattern is drawing attention due to its potential as a bullish engulfing formation. Such a structure often emerges after consolidation, when price attempts to push higher following accumulation phases. The chart also shows volume activity clustering around the recent consolidation, pointing to heightened market participation at current levels.
Notably, earlier consolidation zones on the chart share structural similarities with the ongoing pattern. Previous phases of narrowing ranges have preceded stronger moves, a factor that observers are considering when analyzing the present structure. The latest performance also reflects broader activity within the ecosystem , where marketing visibility has increased internationally.
The combination of tighter price action, consistent support, and a defined resistance band provides a framework for assessing next steps. For now, the token’s current levels remain significant as participants monitor for either renewed expansion or extended consolidation.