
Mega Whales Keep ASTER’s All-Time High Hopes Alive — If It Clears $2.27

ASTER price action is flashing strength even as exchange flows rise. Mega whales are adding, indicators stay firm, and one key level could decide whether ASTER charts a new all-time high soon.
ASTER’s recent listing on Binance has pulled the token back into the spotlight. While the ASTER price briefly cooled to under $2 after strong gains, large-holder activity and strengthening indicators suggest the story is far from over.
The short-term data points to a tug-of-war between liquidity positioning and genuine selling, but if the bulls are right, leaving ASTER now might not be the best decision ever. More so as it’s mere 17% south of its recent all-time high.
Mega Whales Accumulate
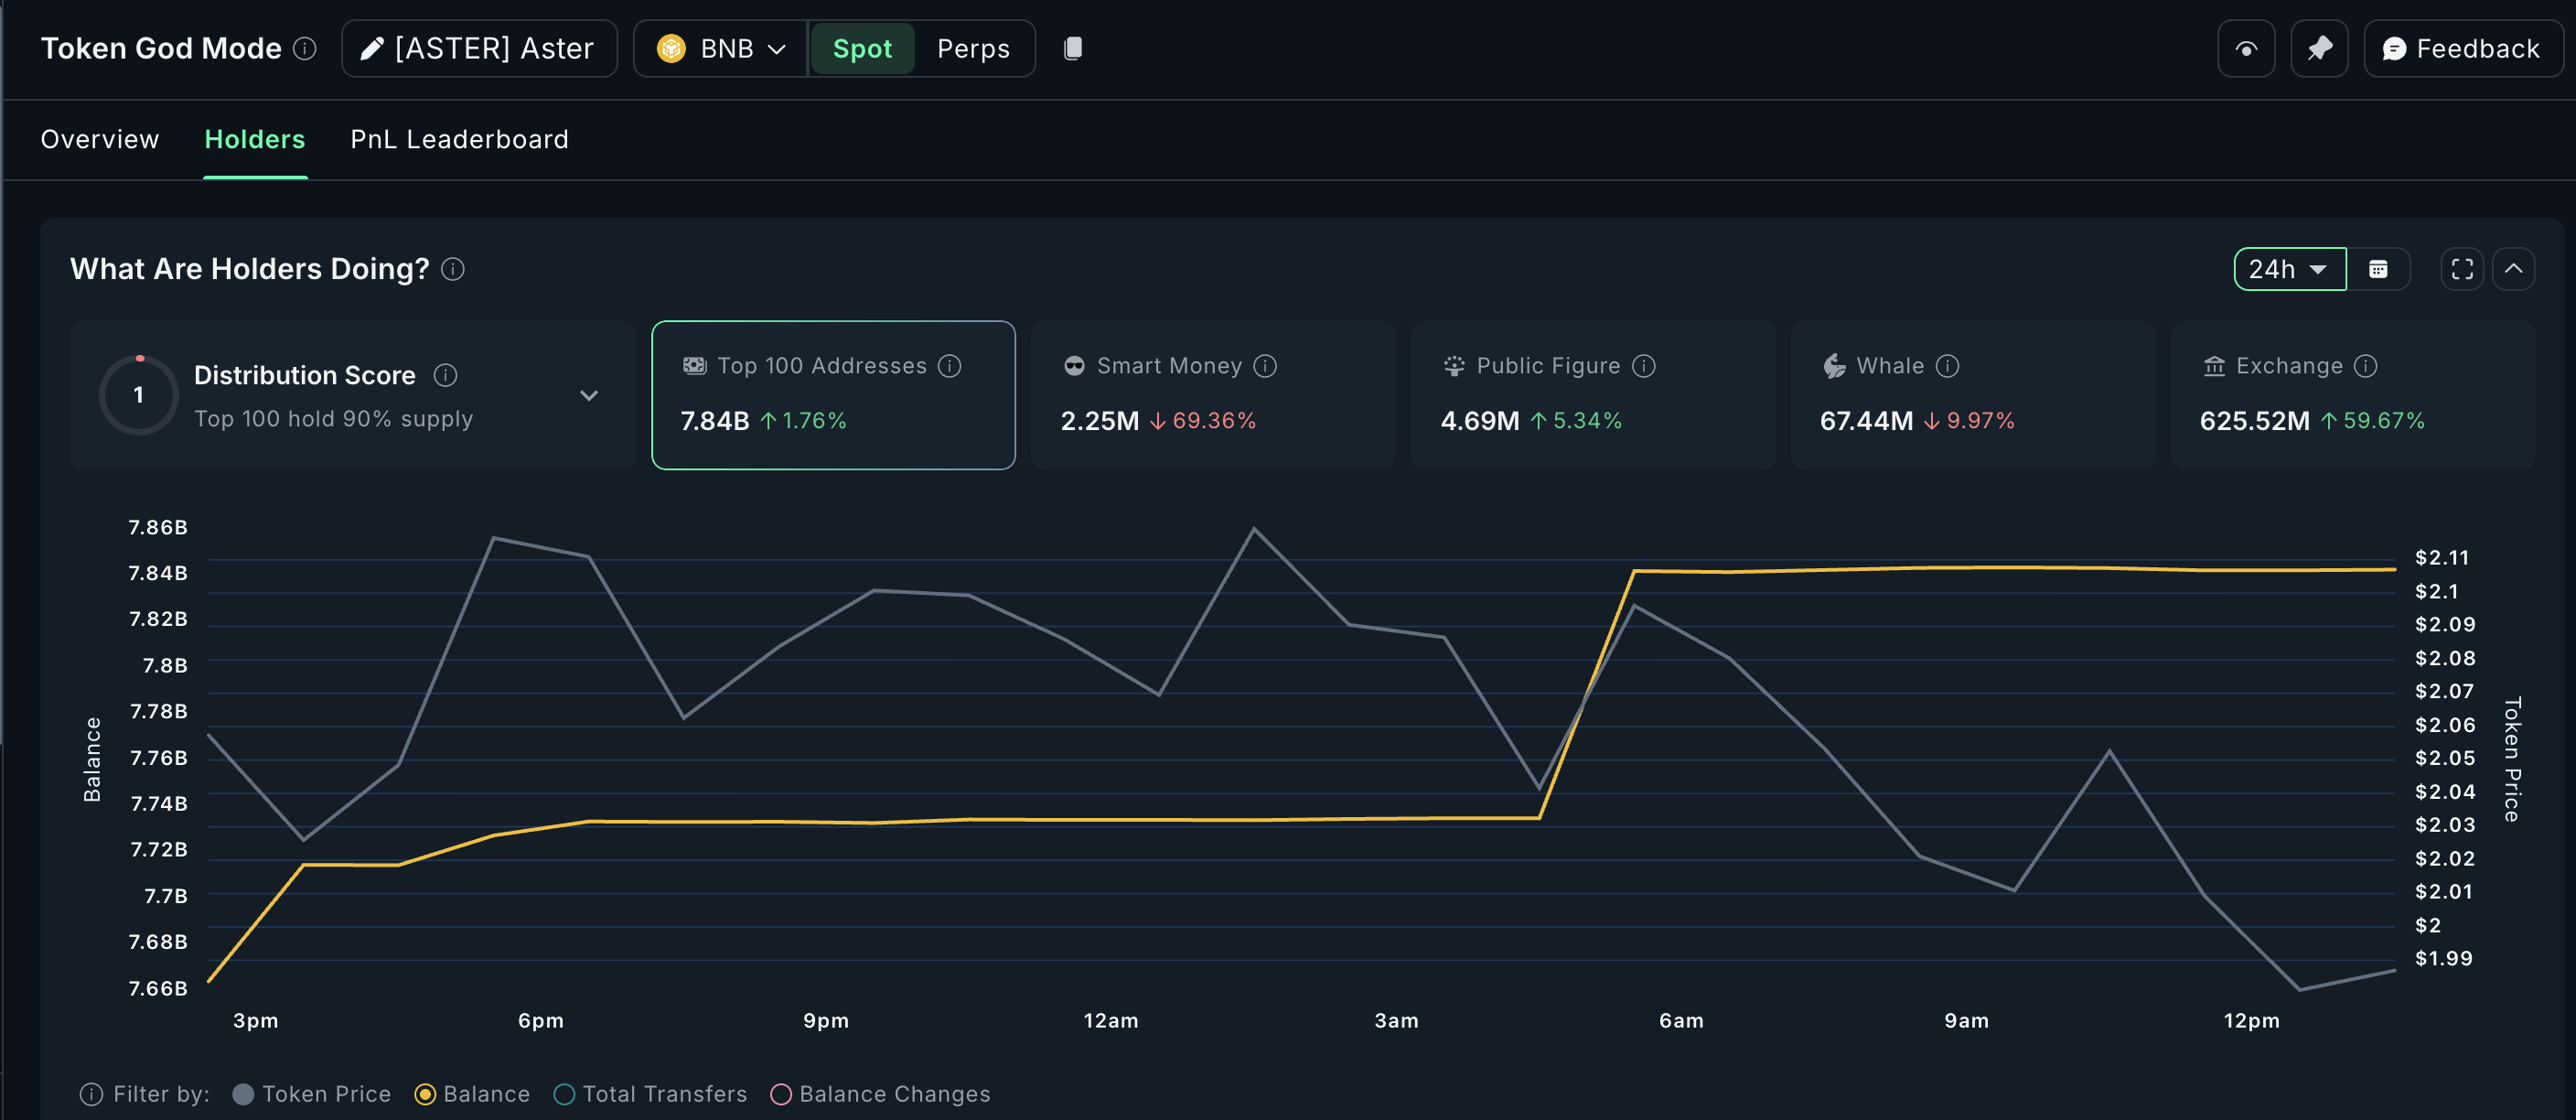
On-chain data shows ASTER’s biggest holders are quietly strengthening their grip.
The top 100 addresses — or “mega whales” — now hold about 7.84 billion ASTER, up 1.76% in 24 hours. That’s roughly 134 million ASTER, worth around $264 million at current prices.
Meanwhile, public-figure wallets have also grown their holdings by 5.34%, adding about 236,000 ASTER (almost $465,000).
 ASTER Holding Pattern:
In contrast, smart-money wallets reduced exposure by nearly 70%, while whales trimmed holdings by 9.97%, selling about 7.5 million ASTER ( close to $15 million).
Exchange balances have surged 59.6% to 625 million ASTER, which could look like heavy selling — but that might be misleading. Given Binance’s new listing, part of this jump could be liquidity repositioning.
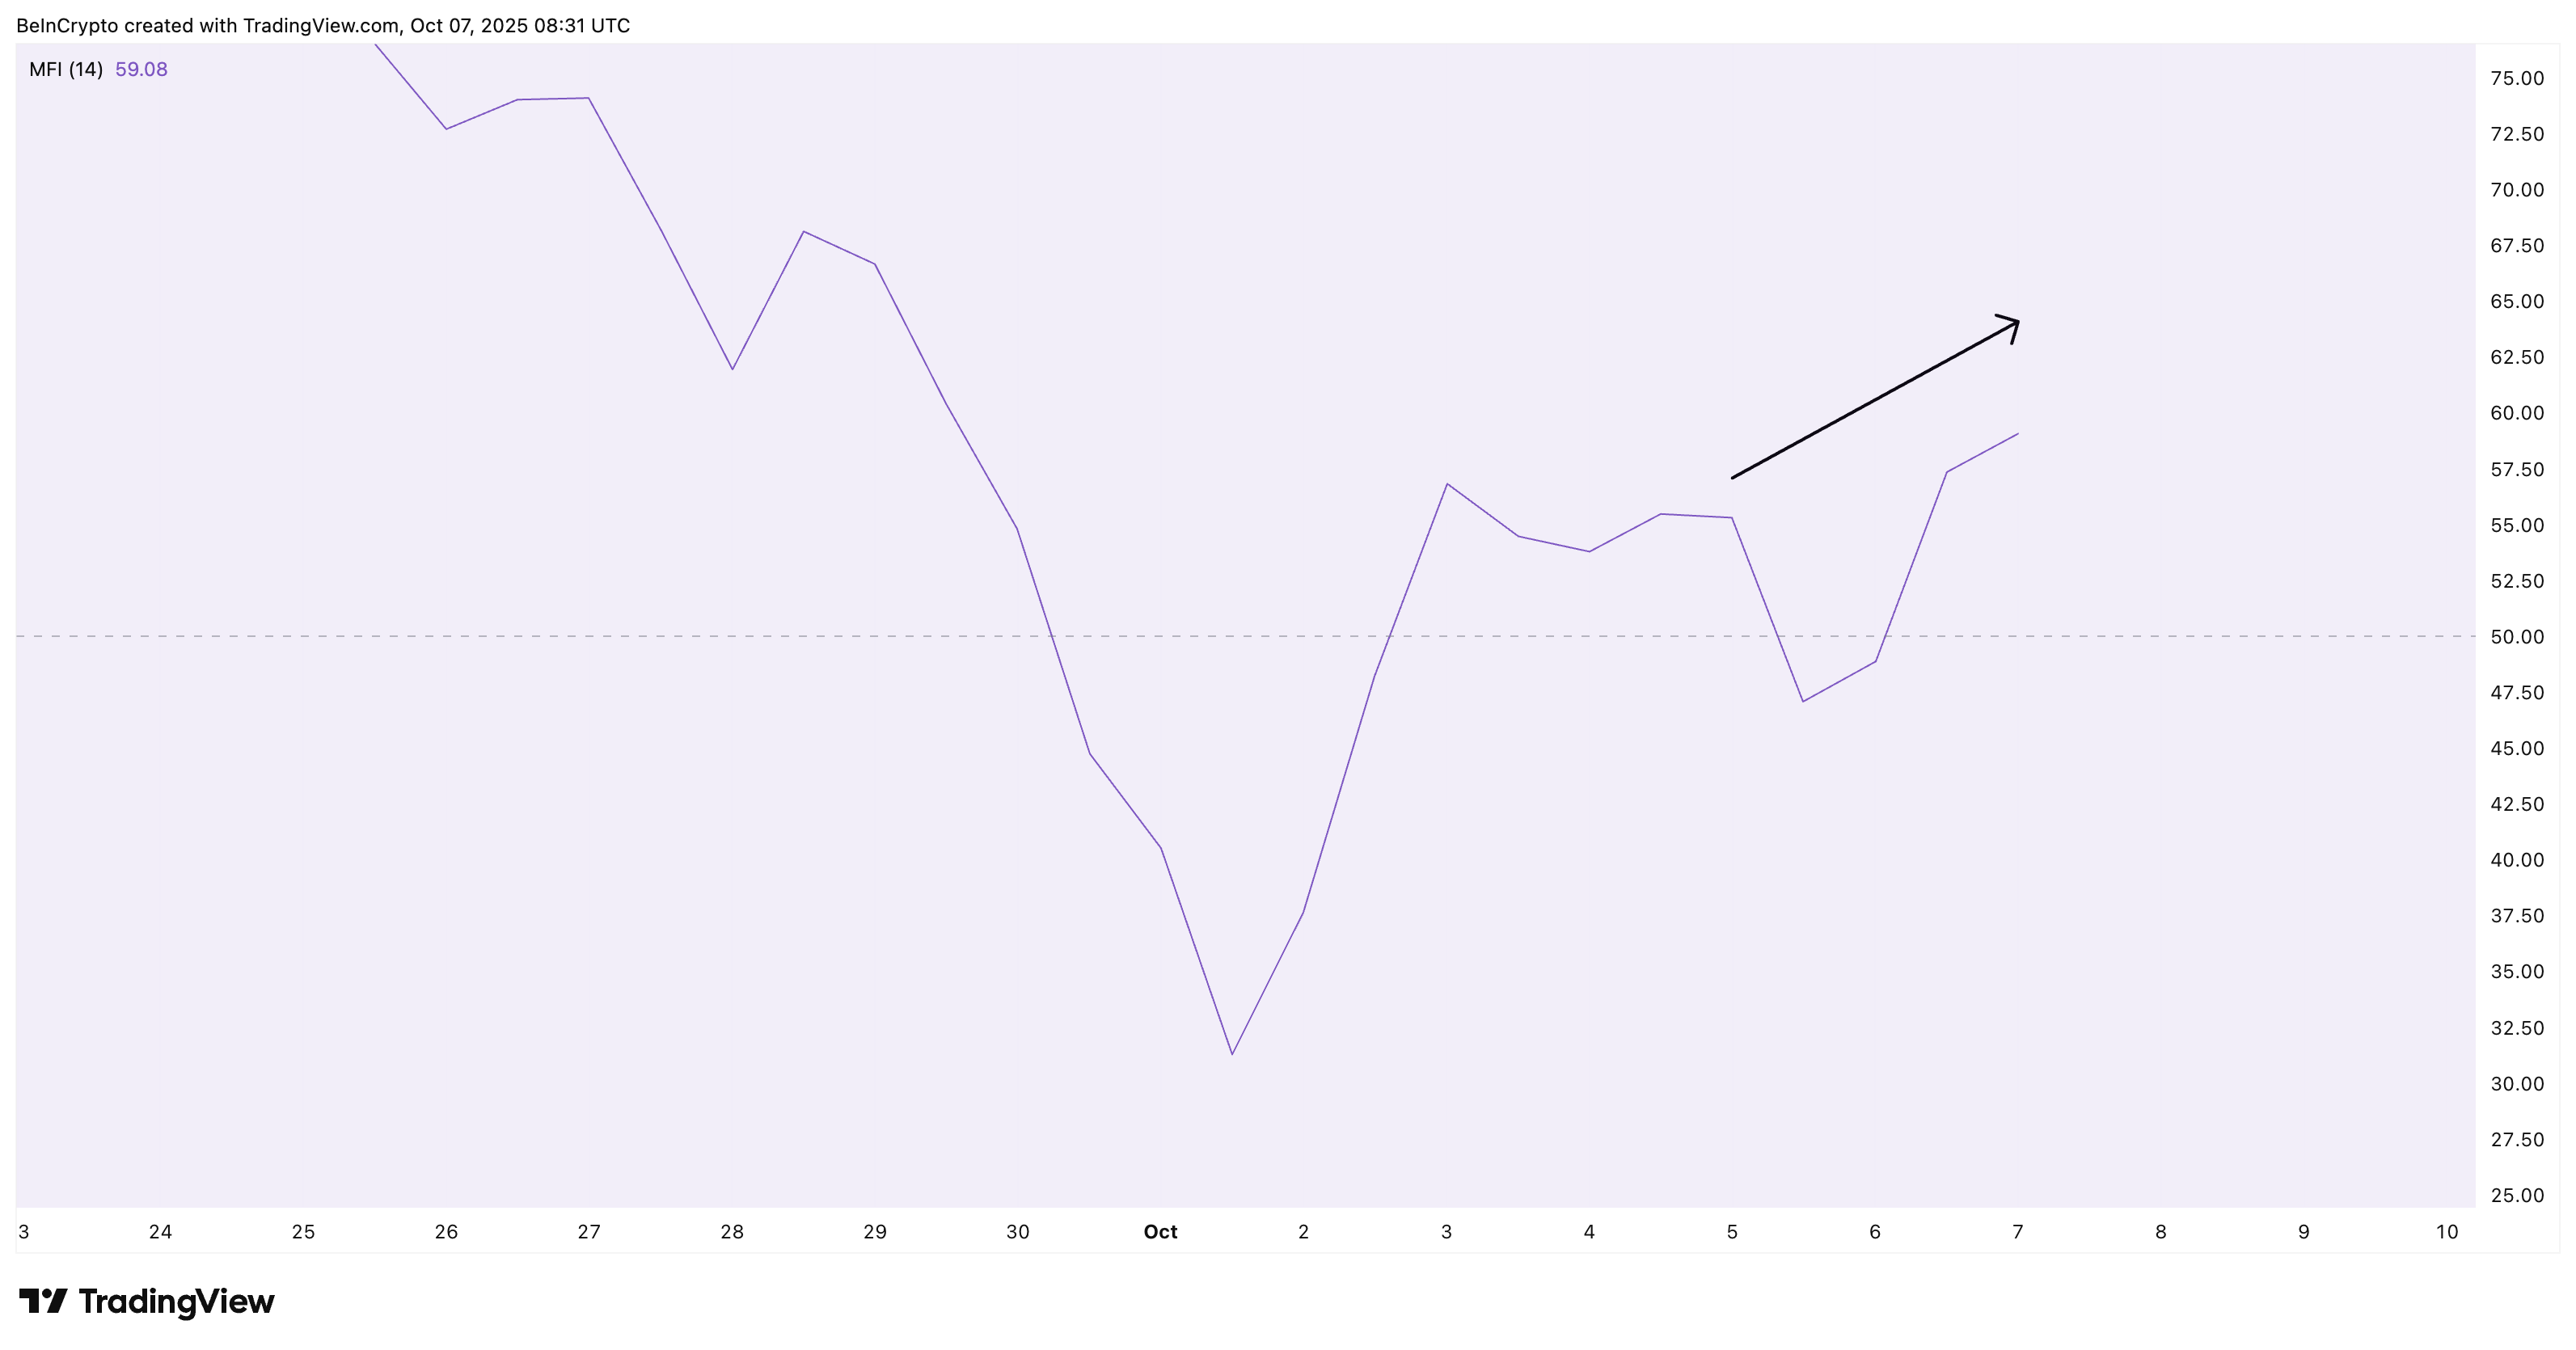
Supporting that, the Money Flow Index (MFI) — which measures buying and selling pressure based on price and volume — is trending upward.
 ASTER MFI Still Trending Higher:
If these inflows were truly sell-driven, MFI would have dropped. Instead, it’s rising toward 65, signaling that money is still flowing into ASTER.
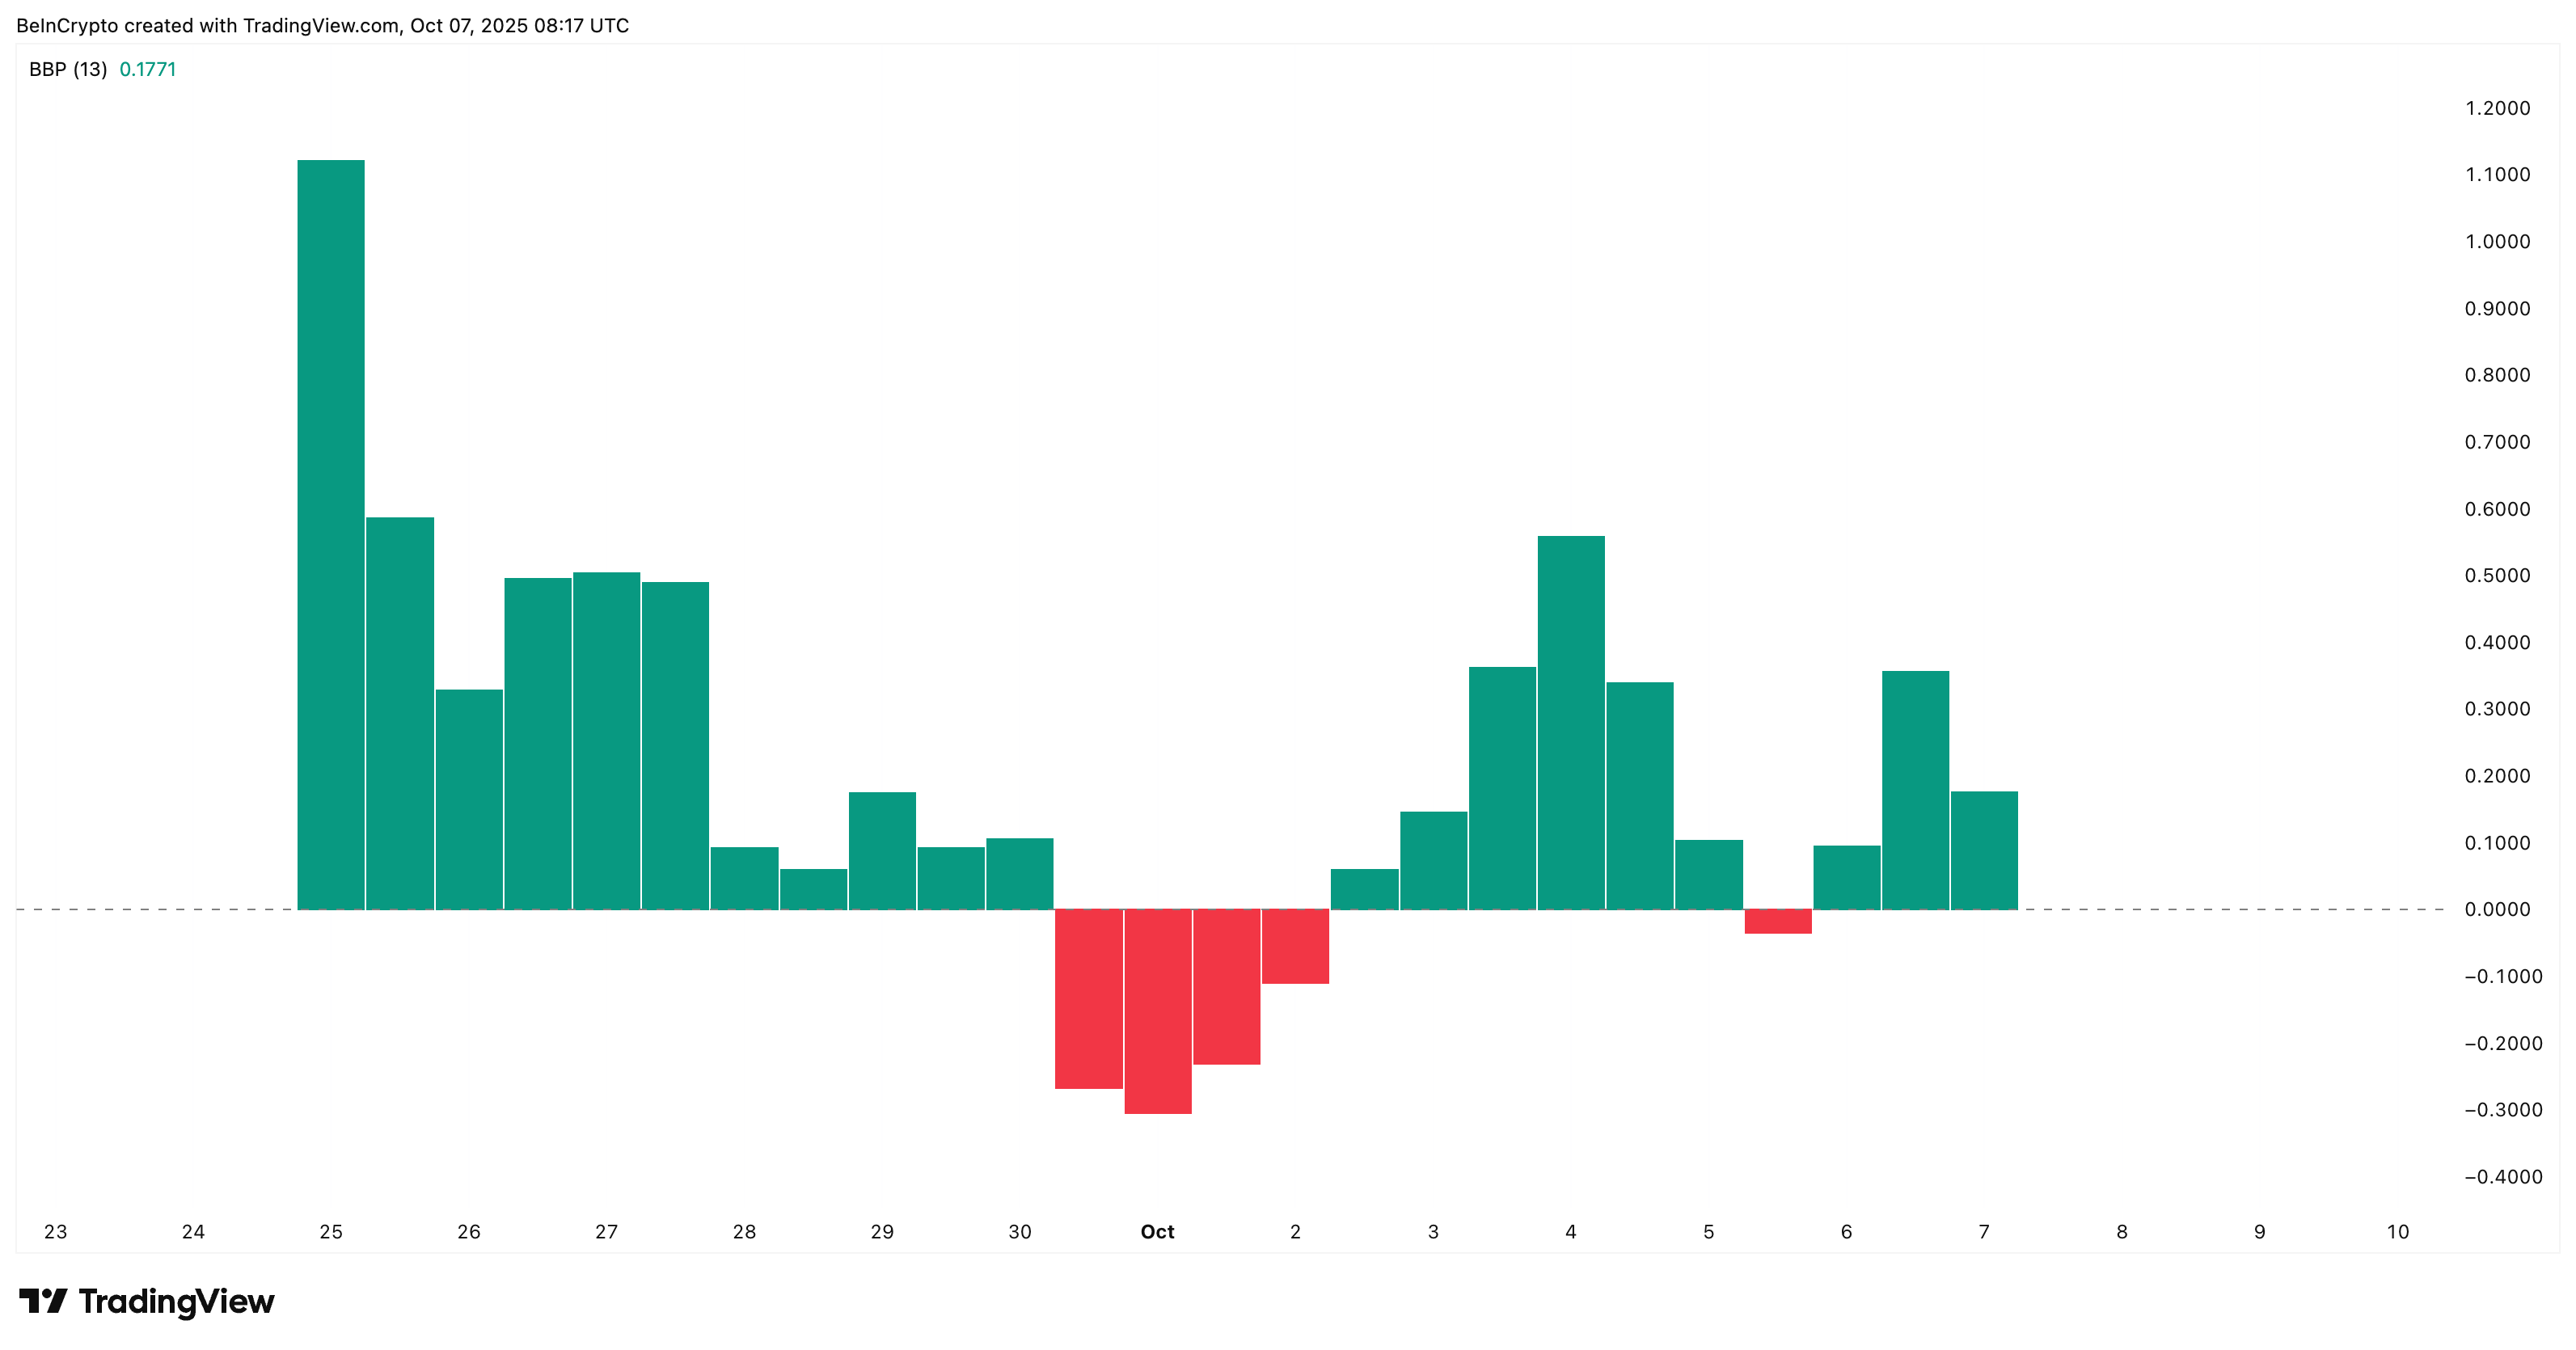
The Bull-Bear Power (BBP) indicator backs this up. BBP compares buying and selling momentum; when it’s green, bulls dominate. Since October 5, BBP bars have turned positive, showing renewed strength.
 ASTER Bulls In Power:
These two readings together suggest the so-called “selling pressure” might be a liquidity mirage, not a trend reversal.
Hidden Bullish Divergence Keeps ASTER Price Uptrend Intact
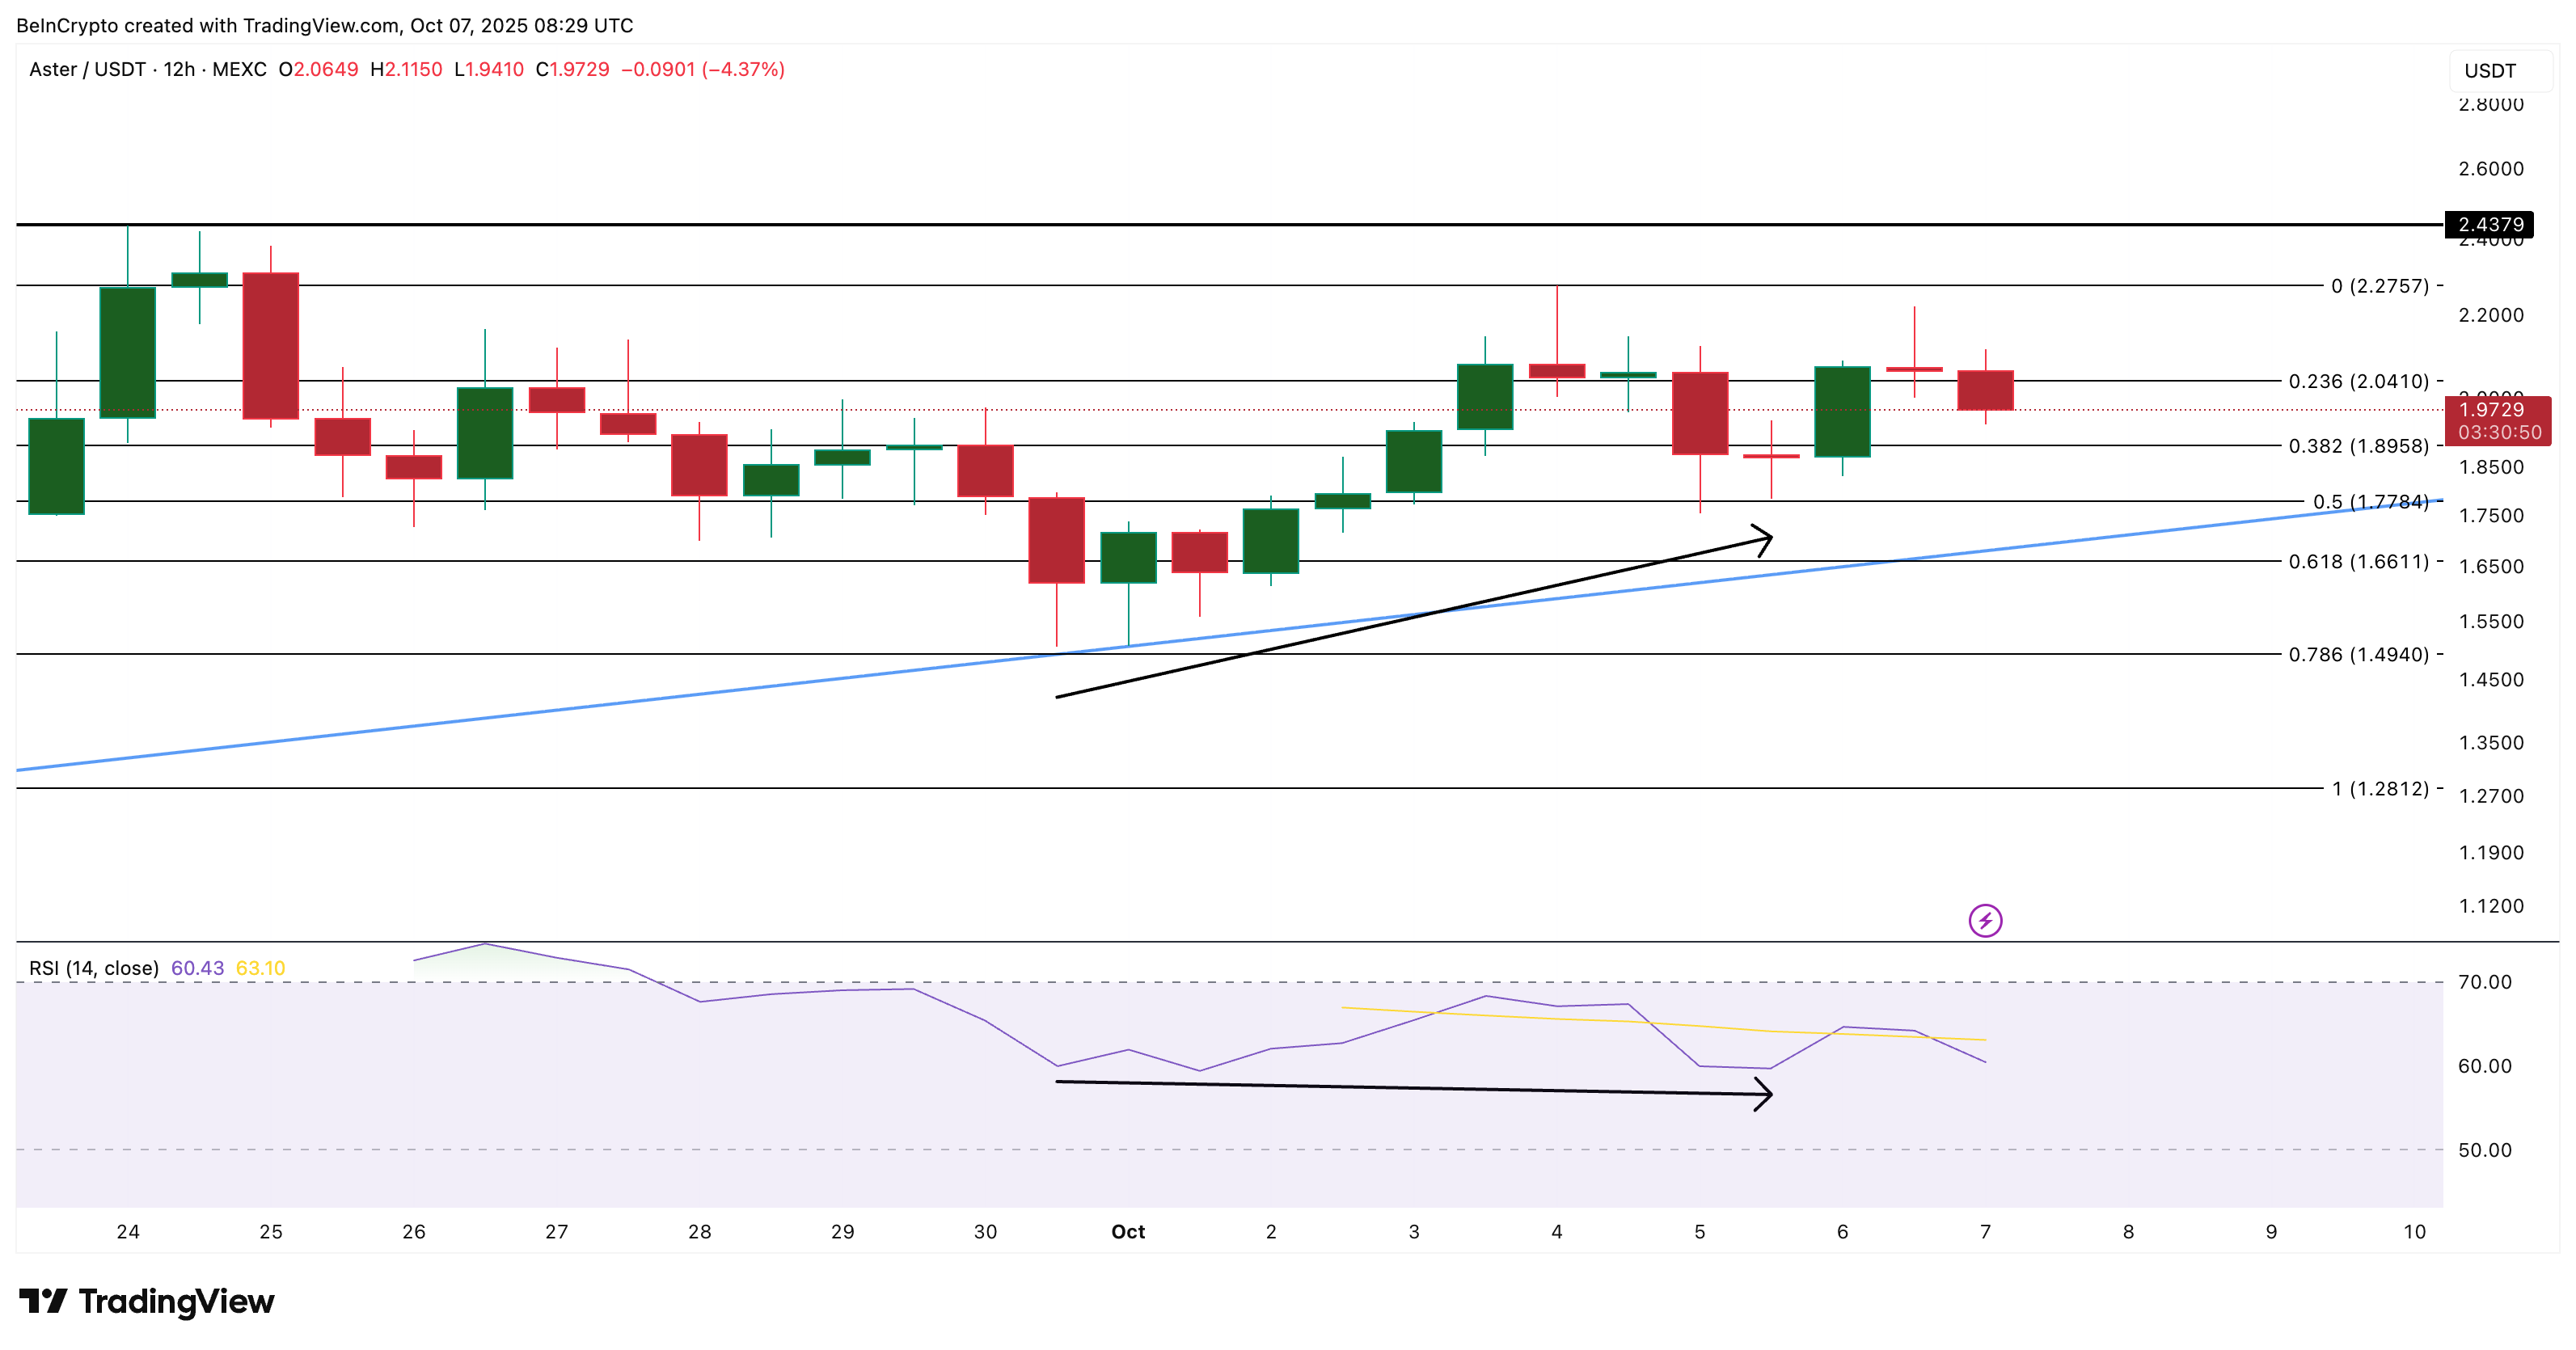
The 12-hour chart shows ASTER trading within an ascending triangle (with the ascending trendline acting as support), a structure that usually favors buyers.
Between September 30 and October 5, the Relative Strength Index (RSI) — which tracks market momentum — made a lower low, while prices made a higher low. This is called a hidden bullish divergence, a pattern that often confirms the continuation of an uptrend courtesy of fading selling pressure.
 ASTER Price Analysis:
Key resistance sits at $2.04, $2.27, and $2.43 (ASTER’s all-time high). A 12-hour candle close above $2.27 would confirm breakout strength and could open the door to a new high above $2.43.
However, if the ASTER price dips under $1.77 and then under $1.66, thereby breaching the triangle on the downside, the bullish hypothesis would get invalidated.
As long as RSI stays above 50 and BBP remains positive, bulls hold the edge. For now, ASTER’s price action tells a simple story: the big holders haven’t left the table — and neither should the market’s attention.
Disclaimer: The content of this article solely reflects the author's opinion and does not represent the platform in any capacity. This article is not intended to serve as a reference for making investment decisions.
You may also like
Firelight Brings XRP Staking to Flare
YFI rises 4.93% over 24 hours during turbulent market conditions
- YFI surged 4.93% in 24 hours to $3906, contrasting a 51.37% annual decline amid DeFi sector volatility. - DeFi Technologies faces a class action lawsuit after a 27.59% stock drop, CEO exit, and slashed revenue forecasts. - BI DeFi launched new yield products to stabilize returns as regulatory scrutiny and market uncertainty persist. - Legal firms urge investors to act by January 30, 2026, while DeFi’s long-term outlook remains bearish despite short-term rallies.

SOL Price Forecast and Key Drivers in Late 2025: Evaluating Solana’s Core Improvements and Ecosystem Growth
- Solana's 2025 upgrades (Firedancer, Alpenglow) enhance scalability, achieving 870.6 TPS and 16-month uptime, boosting institutional confidence. - Ecosystem growth accelerates with $10.2B DeFi TVL, 17,708 developers, and partnerships like Western Union expanding real-world use cases. - Price analysis shows SOL near $133 support level, with bullish indicators and ETF inflows suggesting potential $150–$500 range by late 2025. - Historical correlations link upgrades to 400%+ price surges, positioning Solana

Bitcoin Leverage Liquidations Spike in Early December 2025: An Important Lesson on Managing Risks in Unstable Markets
- Early December 2025 saw over $1B in leveraged Bitcoin bets liquidated as prices dropped below $86,000, with major exchanges reporting losses exceeding $160M each. - Sharp price swings and macroeconomic pressures like Japan's hawkish signals triggered cascading liquidations, exposing systemic risks in high-leverage crypto trading. - Institutional investors remained resilient amid the selloff, contrasting retail traders' margin calls and highlighting crypto ETF inflows as stabilizing factors during market
