From the 200-week moving average to the market cap ratio, estimating the peak of Ethereum in this cycle

It may not be as exaggerated as Tom Lee’s $60,000 prediction, but can we look forward to $8,000?
Original Title: Where might ETH Top?
Original Author: Michael Nadeau, The DeFi Report
Translated by: Luffy, Foresight News
Tom Lee recently stated at Korea Blockchain Week that the mid-term target price for Ethereum is $60,000, and noted that Ethereum is currently in a supercycle lasting 10-15 years.
If his judgment is correct, this supercycle will advance in waves, spanning multiple cycles, accompanied by alternating bull and bear markets.
At present, we are in a bull market, but the bull market will not last forever.
Looking back at history, Ethereum fell by 94% in 2018 and by 80% in 2022, so we have reason to predict that a significant correction will still occur in the future.
Currently, we cannot determine when the correction will happen, but by tracking several key indicators, we can refer to the levels Ethereum reached in past cycles to provide a basis for future trends.
Key Indicator Analysis and Price Targets
200-Week Moving Average
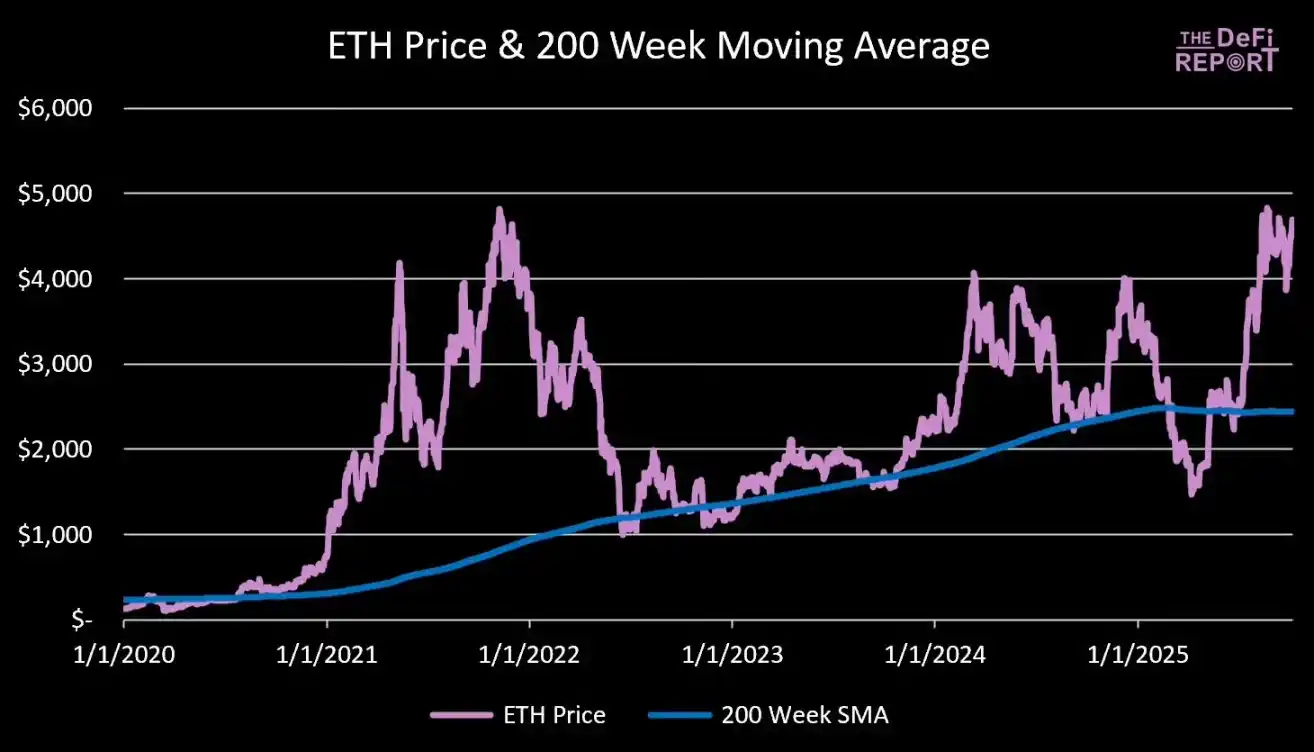
Data Source: The DeFi Report
Currently, Ethereum is trading 92% above its 200-week moving average ($2,400).
In the 2021 cycle, at the market peak, Ethereum was 492% above its 200-week moving average.
Scenario analysis:
· 200% above the 200-week moving average: Ethereum price at $7,300
· 250% above the 200-week moving average: Ethereum price at $8,500
· 300% above the 200-week moving average: Ethereum price at $9,800
· 350% above the 200-week moving average: Ethereum price at $11,000
· 400% above the 200-week moving average: Ethereum price at $12,200
Note: The 200-week moving average is a dynamic indicator, but over time, we are gradually replacing price data from about four years ago in the $3,000-$4,000 range. Therefore, by the end of this year, the volatility of the 200-week moving average is expected to be very small.
Ethereum Price to Realized Price Ratio
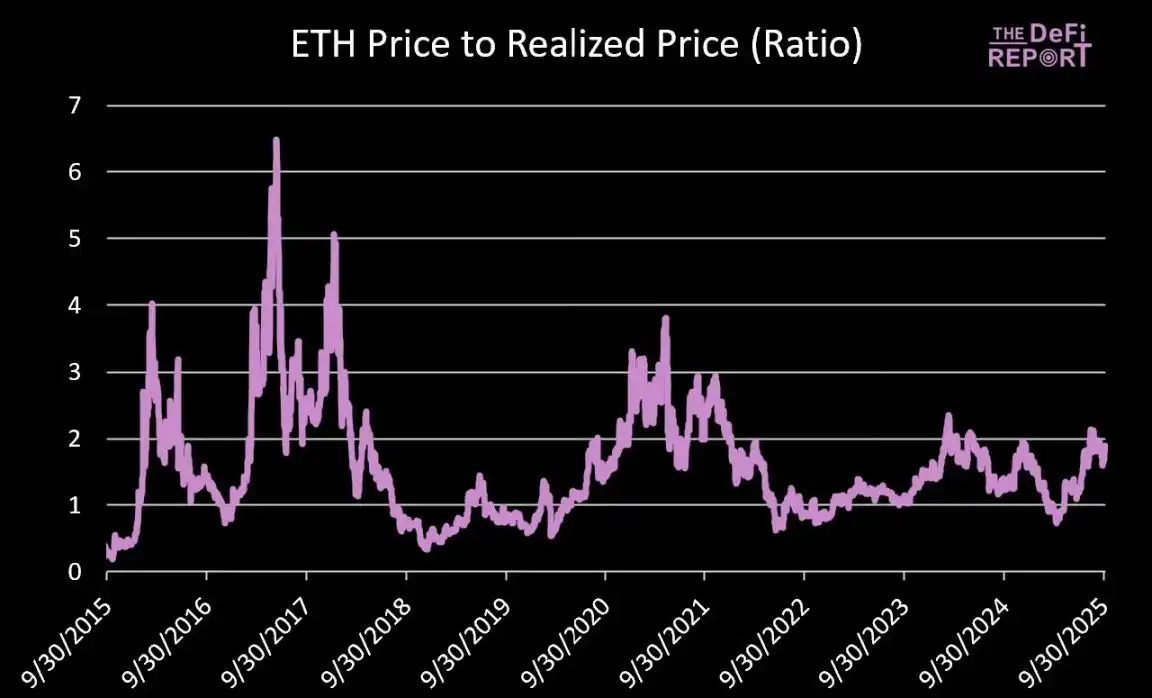
Data Source: The DeFi Report, Glassnode
The realized price can serve as an alternative indicator for cost basis. Since January 1, 2017, the average ratio of Ethereum price to realized price has been 1.6. The current ratio is 1.9.
In the 2017 cycle, the peak ratio was 5; in the 2021 cycle, the peak ratio was 3.5 in April and 2.9 in November.
Scenario analysis (assuming the ratio reaches 2.9):
· If the realized price is $3,000: Ethereum price at $8,700
· If the realized price is $3,500: Ethereum price at $10,200
· If the realized price is $4,000: Ethereum price at $11,600
MVRV Z-Score
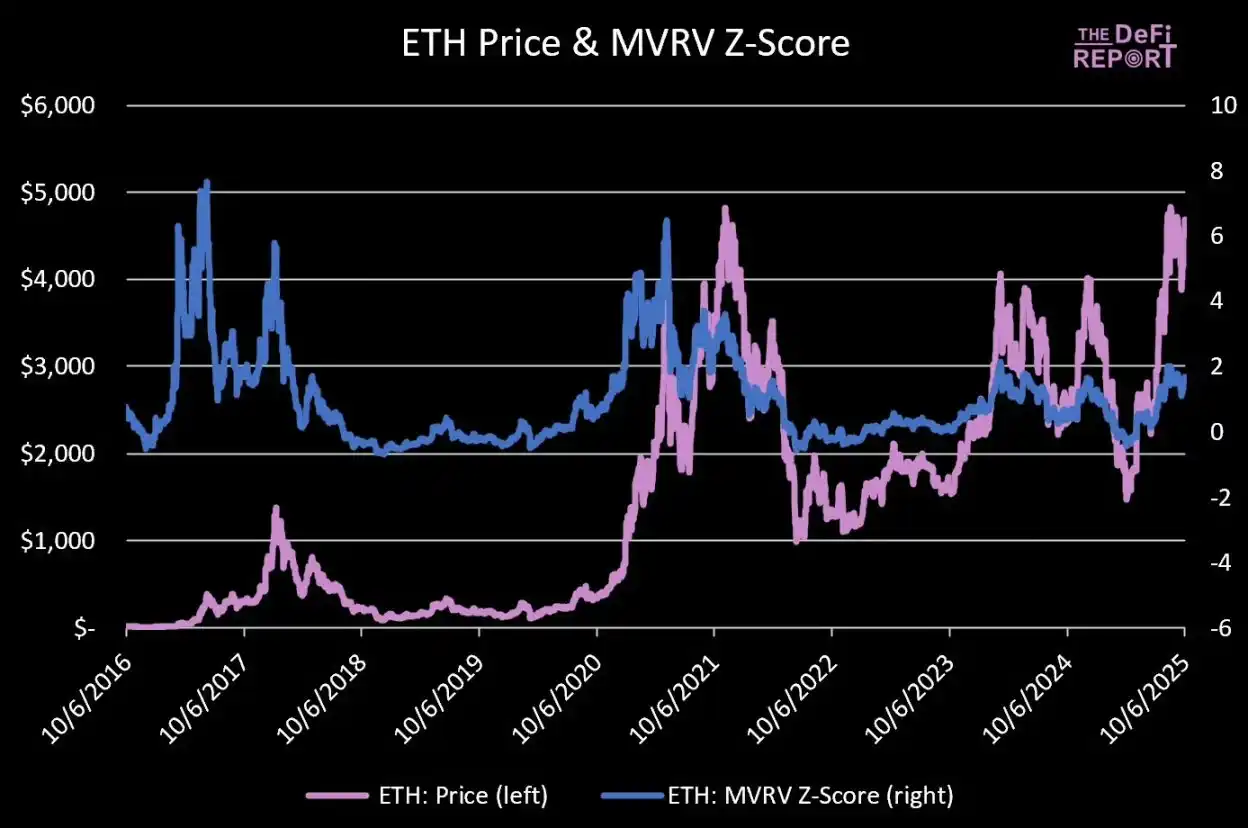
Data Source: The DeFi Report, Glassnode
The Z-score measures how many "volatility units" the market cap is above or below the on-chain cost basis. The higher the Z-score, the hotter the market; a negative Z-score indicates the market is undervalued.
Since January 1, 2017, Ethereum's average Z-score has been 0.99, indicating the market is generally optimistic.
The current Z-score is 1.66, which is above the historical average but not yet overheated.
In the 2021 cycle, the peak Z-score was 6.5 in April and 3.48 in November.
Scenario analysis:
· If the Z-score is 2.21: Ethereum price at $7,000
· If the Z-score is 2.77: Ethereum price at $8,000
· If the Z-score is 3.33: Ethereum price at $9,000
· If the Z-score is 3.9: Ethereum price at $10,000
Note: Assuming by the end of this year, the realized price rises by 22% (to $3,000). For reference, since April this year, the realized price has already risen by 24%.
Ethereum to Bitcoin Market Cap Ratio
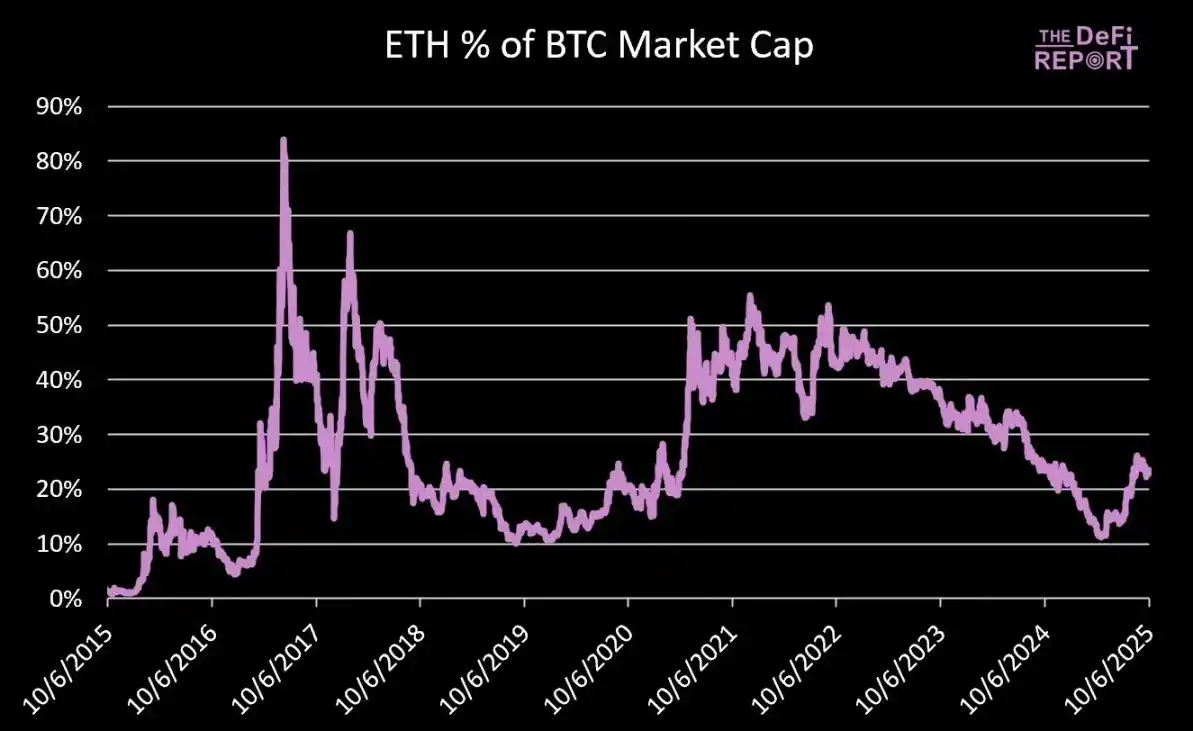
Data Source: The DeFi Report
Currently, Ethereum's market cap is about 23.4% of Bitcoin's market cap.
In November 2021, Ethereum's market cap reached 55.5% of Bitcoin's market cap.
If Bitcoin's price reaches $150,000 (a 23% increase from now), its market cap will reach $3 trillion.
Scenario analysis:
· If Ethereum's market cap is 35% of Bitcoin's: Ethereum total market cap is $1.05 trillion, corresponding price is $8,658
· If Ethereum's market cap is 45% of Bitcoin's: Ethereum total market cap is $1.35 trillion, corresponding price is $11,132
· If Ethereum's market cap is 55% of Bitcoin's: Ethereum total market cap is $1.64 trillion, corresponding price is $13,559
The core question is whether Bitcoin will see a significant surge. Compared to the previous cycle, will Ethereum's gains relative to Bitcoin be moderate or explosive?
Ethereum to Nasdaq Index Ratio
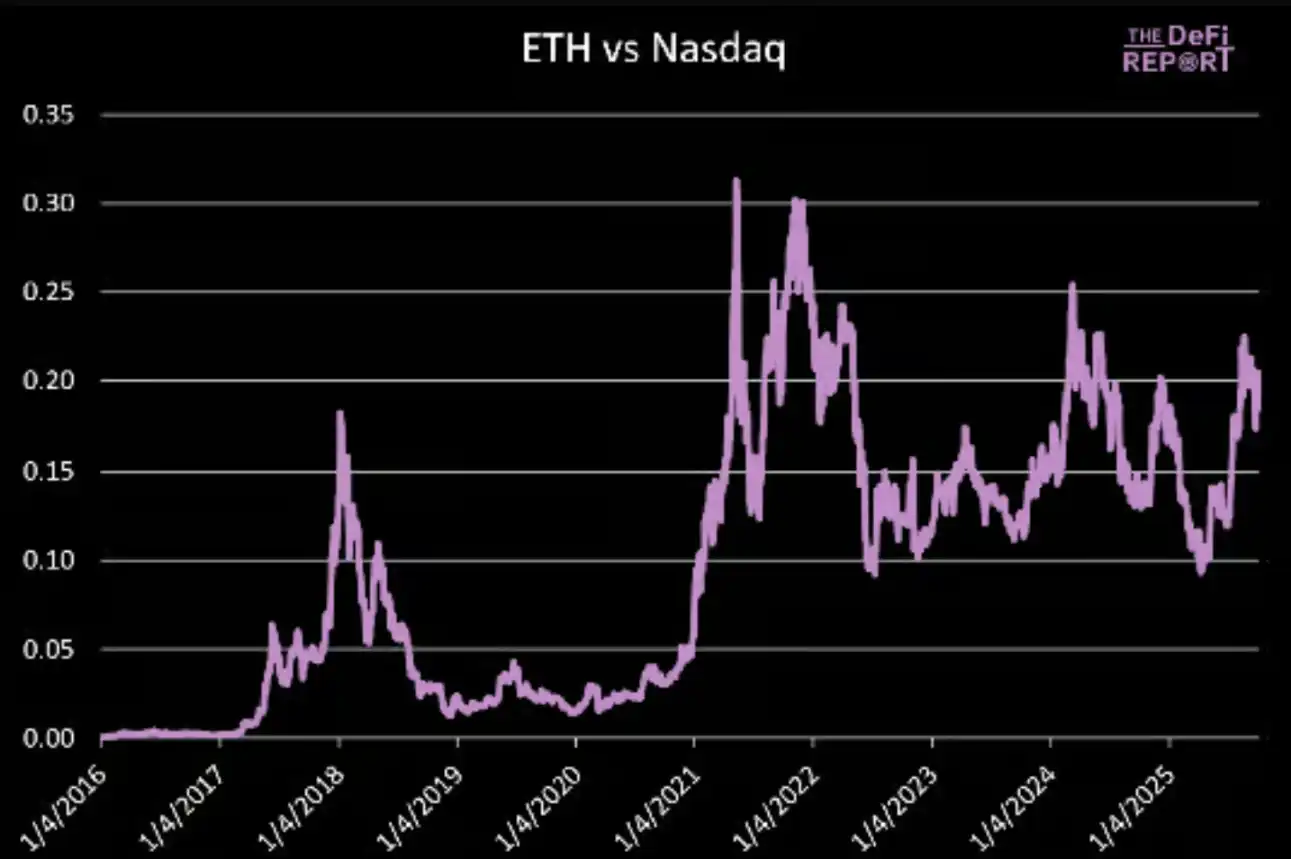
Data Source: The DeFi Report
In May and November 2021, the peak ratios of Ethereum to the Nasdaq Index were 0.31 and 0.30, respectively.
The current ratio is 0.20, and the current Nasdaq Index is at 22,788 points.
If the Nasdaq Index rises 5% by the end of this year (up 23% for the year), it will reach 23,927 points.
Ethereum price scenario analysis:
· If the ratio is 0.25: Ethereum price at $5,981
· If the ratio is 0.30: Ethereum price at $7,178
· If the ratio is 0.35: Ethereum price at $8,374
· If the ratio is 0.40: Ethereum price at $9,570
Our baseline assumption is that the upward trend in the Ethereum to Nasdaq Index ratio will continue with the cycle, and the ratio will reach a new high (above 0.30) in this cycle.
Summary
Our basic assumptions are as follows:
· Ethereum price is 250% above the 200-week moving average, corresponding to a price of $8,500;
· Realized price reaches $3,000, and if the price-to-realized price ratio is 2.9, Ethereum price is $8,700;
· Ethereum's market cap reaches 35% of Bitcoin's, and if Bitcoin's price is $150,000, Ethereum price is $8,600;
· Ethereum to Nasdaq Index ratio reaches a new high, and if the ratio is 0.35, Ethereum price is $8,300.
If the bull market continues, Ethereum price may break through $10,000; if the market turns bearish and Bitcoin's peak gains are limited, Ethereum will also come under pressure.
Meanwhile, as market sentiment heats up, more and more discussions about "cycle extension" are emerging, which reminds me of the "supercycle" narrative that was popular in 2021.
As we have said before, the baseline assumption remains: Ethereum will reach the cycle peak this quarter.
Disclaimer: The content of this article solely reflects the author's opinion and does not represent the platform in any capacity. This article is not intended to serve as a reference for making investment decisions.
You may also like
Coinpedia Digest: This Week’s Crypto News Highlights | 29th November, 2025
QNT Price Breaks Falling Wedge: Can the Bullish Structure Push Toward $150?

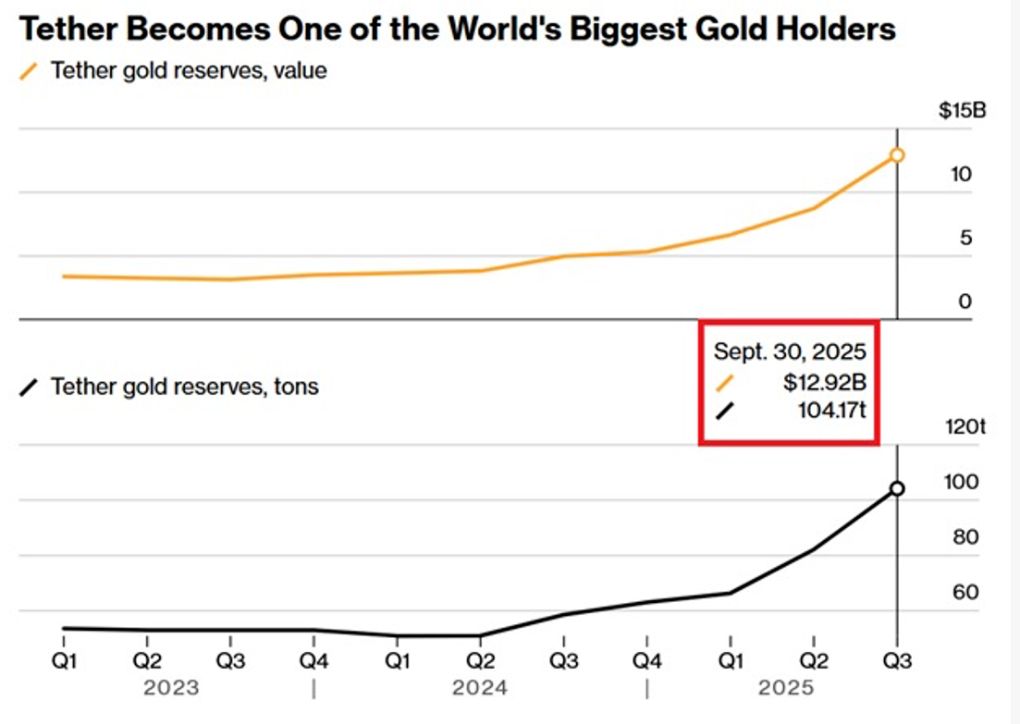
Digital dollar hoards gold, Tether's vault is astonishing!
The Crypto Bloodbath Stalls: Is a Bottom In?