XRP Price Prediction: Consolidation Persists — Bulls Need Fresh Push For Breakout

XRP price started a fresh increase above $2.50. The price is now showing positive signs and might rise further if it clears the $2.6880 resistance.
- XRP price gained pace for a move above $2.50 and $2.550.
- The price is now trading above $2.50 and the 100-hourly Simple Moving Average.
- There is a bullish trend line forming with support at $2.60 on the hourly chart of the XRP/USD pair (data source from Kraken).
- The pair could start a fresh increase if it clears the $2.6880 resistance.
XRP Price Holds Support
XRP price started a fresh increase after it settled above $2.40, like Bitcoin and Ethereum. The price surpassed the $2.420 and $2.50 resistance levels.
The bulls were able to push the price above $2.550 and $2.65. A high was formed at $2.6972 and the price is now consolidating gains above the 23.6% Fib retracement level of the recent move from the $2.327 swing low to the $2.6972 high.
The price is now trading below $2.60 and the 100-hourly Simple Moving Average. There is a bullish trend line forming with support at $2.60 on the hourly chart of the XRP/USD pair.
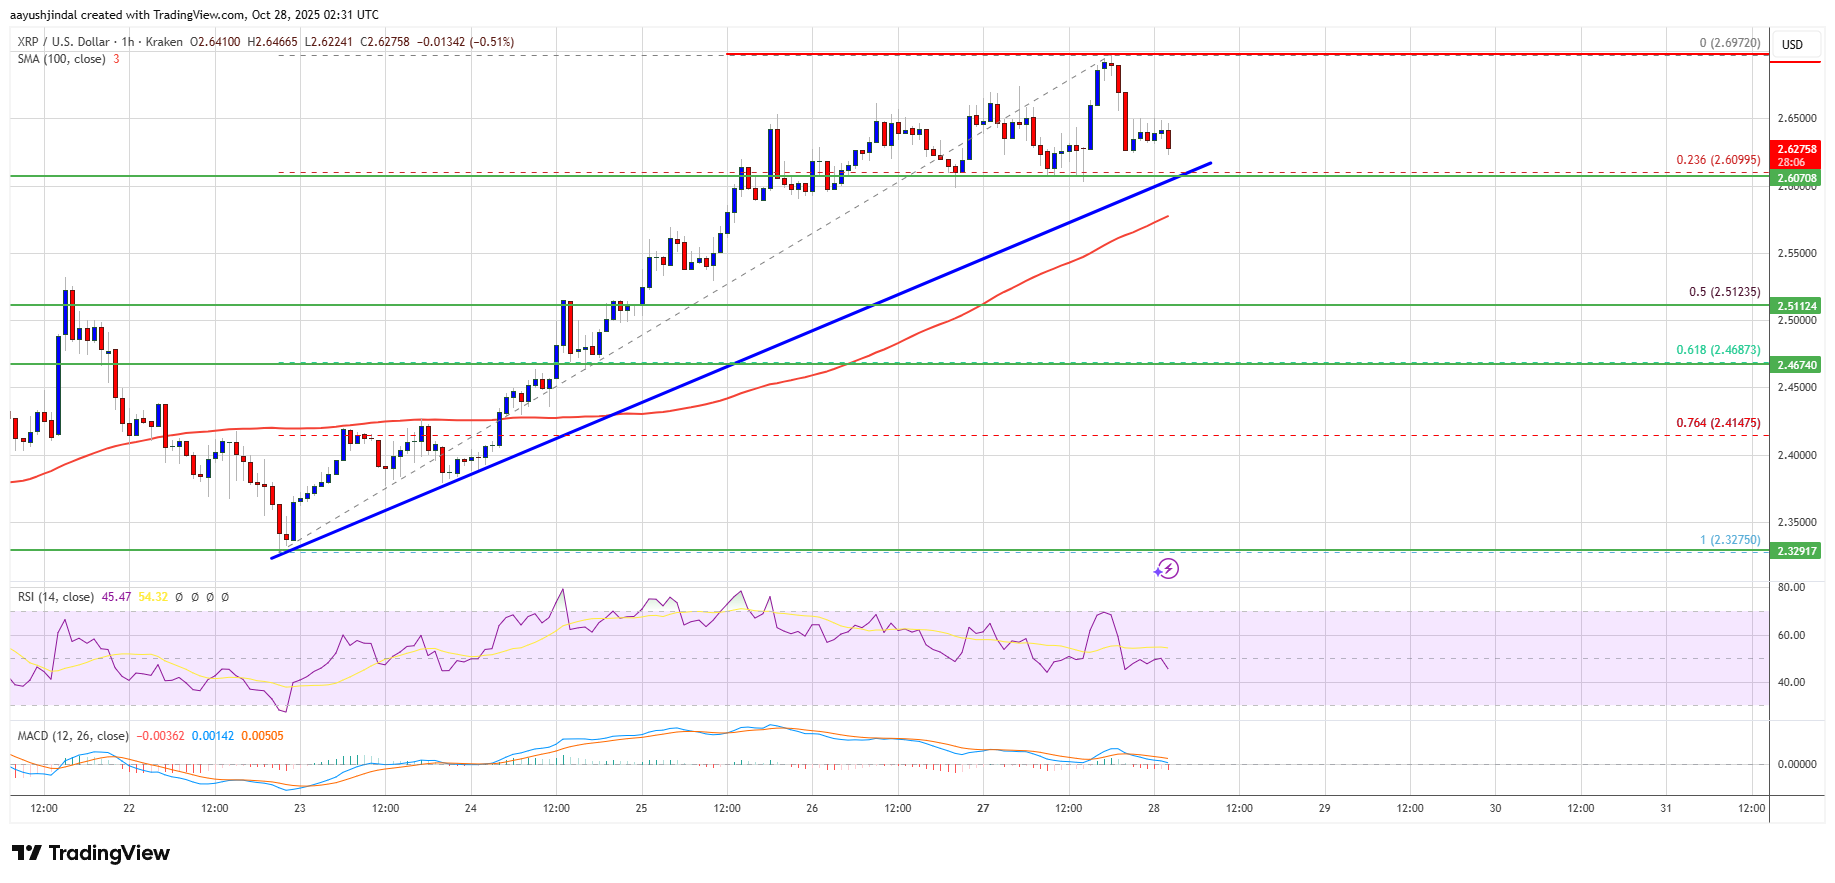
If there is a fresh upward move, the price might face resistance near the $2.650 level. The first major resistance is near the $2.6880 level, above which the price could rise and test $2.70. A clear move above the $2.70 resistance might send the price toward the $2.7650 resistance. Any more gains might send the price toward the $2.80 resistance. The next major hurdle for the bulls might be near $2.880.
Downside Correction?
If XRP fails to clear the $2.6880 resistance zone, it could start a fresh decline. Initial support on the downside is near the $2.60 level. The next major support is near the $2.5650 level.
If there is a downside break and a close below the $2.5650 level, the price might continue to decline toward $2.5120 or the 50% Fib retracement level of the recent move from the $2.327 swing low to the $2.6972 high. The next major support sits near the $2.4680 zone, below which the price could continue lower toward $2.420.
Technical Indicators
Hourly MACD – The MACD for XRP/USD is now losing pace in the bullish zone.
Hourly RSI (Relative Strength Index) – The RSI for XRP/USD is now above the 50 level.
Major Support Levels – $2.60 and $2.580.
Major Resistance Levels – $2.650 and $2.6880.
Disclaimer: The content of this article solely reflects the author's opinion and does not represent the platform in any capacity. This article is not intended to serve as a reference for making investment decisions.
You may also like
Three things that must happen for Bitcoin to avoid bear market
A $500 billion valuation giant is emerging
With a valuation comparable to OpenAI and surpassing SpaceX and ByteDance, Tether has attracted significant attention.

Prediction markets meet Tinder: Can you place bets on Warden's new product by simply swiping left or right?
No need for chart analysis, macro research, or even inputting the amount of funds.

Why does bitcoin only rise when the U.S. government reopens?
The US government shutdown has entered its 36th day, leading to a decline in global financial markets. The shutdown has prevented funds from being released from the Treasury General Account (TGA), draining market liquidity and triggering a liquidity crisis. Interbank lending rates have soared, while default rates on commercial real estate and auto loans have risen, increasing systemic risk. The market is divided over future trends: pessimists believe the liquidity shock will persist, while optimists expect a liquidity release after the shutdown ends. Summary generated by Mars AI. The accuracy and completeness of this summary are still being improved as the Mars AI model is updated.