Key Notes
- Solana rebounded strongly after dipping below $150 earlier this month.
- Trading volume jumprf 60%, reaching $5.52 billion in 24 hours.
- Analysts see potential breakout above $167 that could trigger new highs.
Solana SOL $167.5 24h volatility: 5.2% Market cap: $92.66 B Vol. 24h: $5.63 B has regained bullish momentum after a recent correction pushed its price below the $150 mark. At the time of writing, the cryptocurrency is trading around $168.2, up by 6.4% over the past 24 hours, adding nearly $6 billion to its market capitalization.
The rally has also boosted SOL’s 24-hour trading volume by 60%. According to the data by CoinMarketCap. The total volume now stands at $5.52 billion, reflecting renewed investor confidence.
Analysts Highlight Key Zones
According to popular market analyst Hardy, Solana has been forming an ascending triangle pattern since early November, a pattern often suggesting bullish continuation. He noted that SOL faces a key resistance level near $167.
NGL fam – $SOL is looking very good here for a reversal. 👀
As long as Bitcoin doesn't scam pump, we could see this reach for the highs.
Ascending triangle full send! 🔥 pic.twitter.com/Kx07bGZWaD
— Hardy (@Degen_Hardy) November 10, 2025
The analyst believes that a sustained close above this level could lead SOL to a rally toward $184, assuming Bitcoin maintains its current momentum without sudden volatility spikes.
On-chain analyst Ali Martinez also shared Solana’s UTXO Realized Price Distribution (URPD) chart by Glassnode. The data visualizes the price levels at which current holders last transacted their tokens.
For Solana $SOL , $147.49 is the most important support level! pic.twitter.com/L7l1Ov5HX3
— Ali (@ali_charts) November 10, 2025
Martinez pointed out that the $147.49 range shows the highest concentration of buying activity, making it a crucial support zone. Maintaining strength above this level signals strong market confidence, while a breakdown could expose SOL to further downside pressure.
This price optimism comes as Solana recently outperformed rivals , including Ethereum and BNB Chain, in DEX volumes and staking activity.
SOL Shows Signs of Early Bullish Momentum
On the daily chart, the Bollinger Bands show that SOL is rebounding from the lower band near $148. It is now approaching the midline (20-day SMA) around $168, a sign of improving momentum.
A clear breakout above the upper band near $179 could validate bullish continuation.
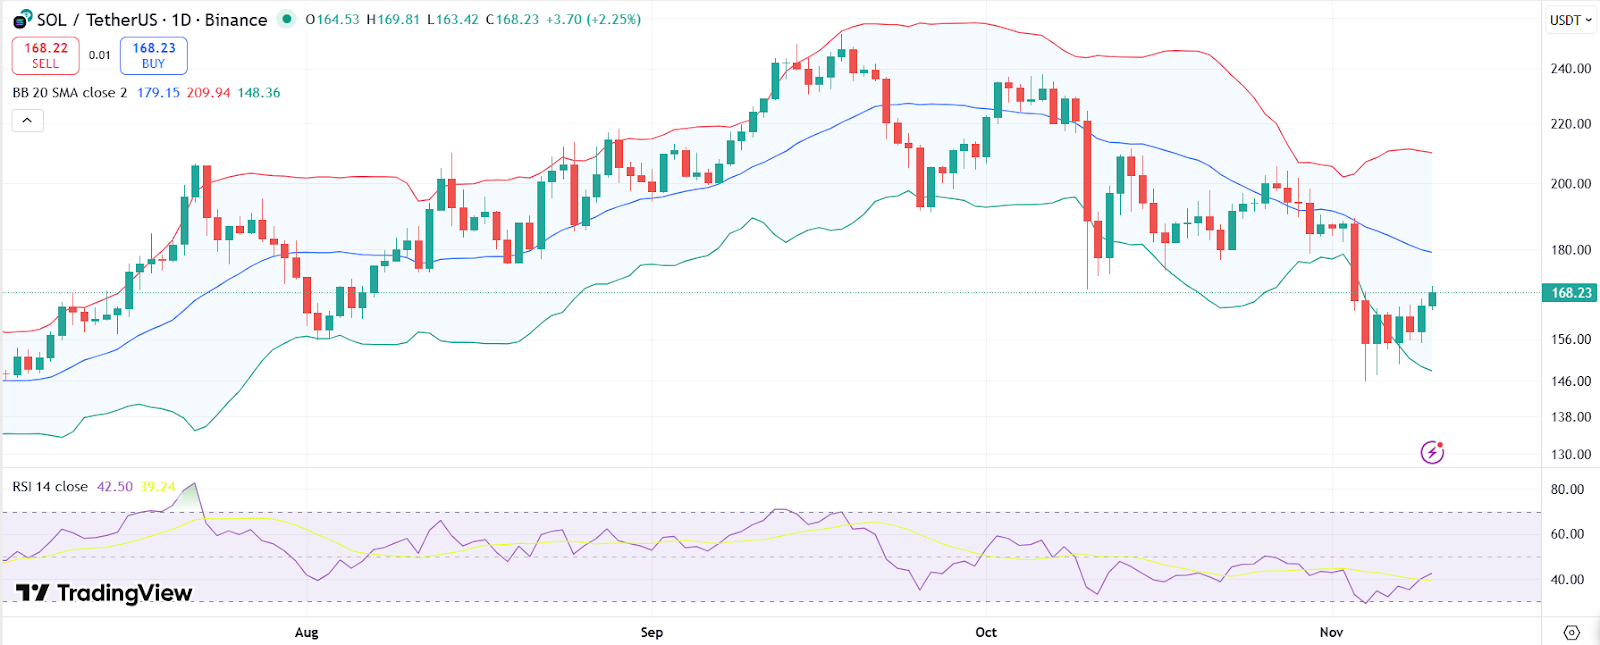
SOL price chart with RSI and Bollinger Bands | Source: TradingView
Meanwhile, the RSI is currently indicating that the cryptocurrency has emerged from oversold territory and has enough room to surge before overbought conditions.
If RSI climbs further upwards, alongside expanding Bollinger Band width, it could confirm renewed buying strength. Analysts suggests that a sustained surge could help Solana to retest the $200 zone in the coming weeks.
PEPENODE Secures Over $2M as SOL Price Jumps
The excitement around SOL price surge is spilling over to PEPENODE , a new project drawing strong investor interest. The team behind PEPENODE wants to make crypto mining fun, accessible, and interactive, turning what’s usually a technical process into a virtual gaming experience.
Instead of spending thousands on mining hardware, users can build their own digital mining empires inside the platform. The game lets players set up virtual server rooms, purchase and upgrade miner nodes, and improve their digital setups to boost performance.
Pepenode is designed to be simple to use, even for newcomers, while still offering depth and strategy for experienced players.
PEPENODE Token Model
Built on the Ethereum network, PEPENODE runs on a deflationary token model. This means that about 70% of tokens used in node purchases and upgrades are burned, gradually shrinking the total supply.
This mechanism is designed to increase scarcity over time and potentially enhance token value.