
Buyers Still Want a Piece of Pi Coin — But That Might Not Be a ‘Smart’ Move Now

The PI Coin price is holding better than the market, but the signals behind it don’t match. Money flow shows buyers, yet volume and smart money tell a different story.
Pi Coin price is down almost 5% today and roughly 2.3% this week. It has kept only 1% of its monthly gains. It also held better than the broader crypto slide, with the market falling about 6% while Pi Coin sank 4.8%. That looks like strength at first glance, but this kind of “holding better” often happens when an asset is simply lagging, not leading.
The indicators show why the move is not as stable as it looks.
Buyers Are Active, but the Support Behind Them Looks Weak
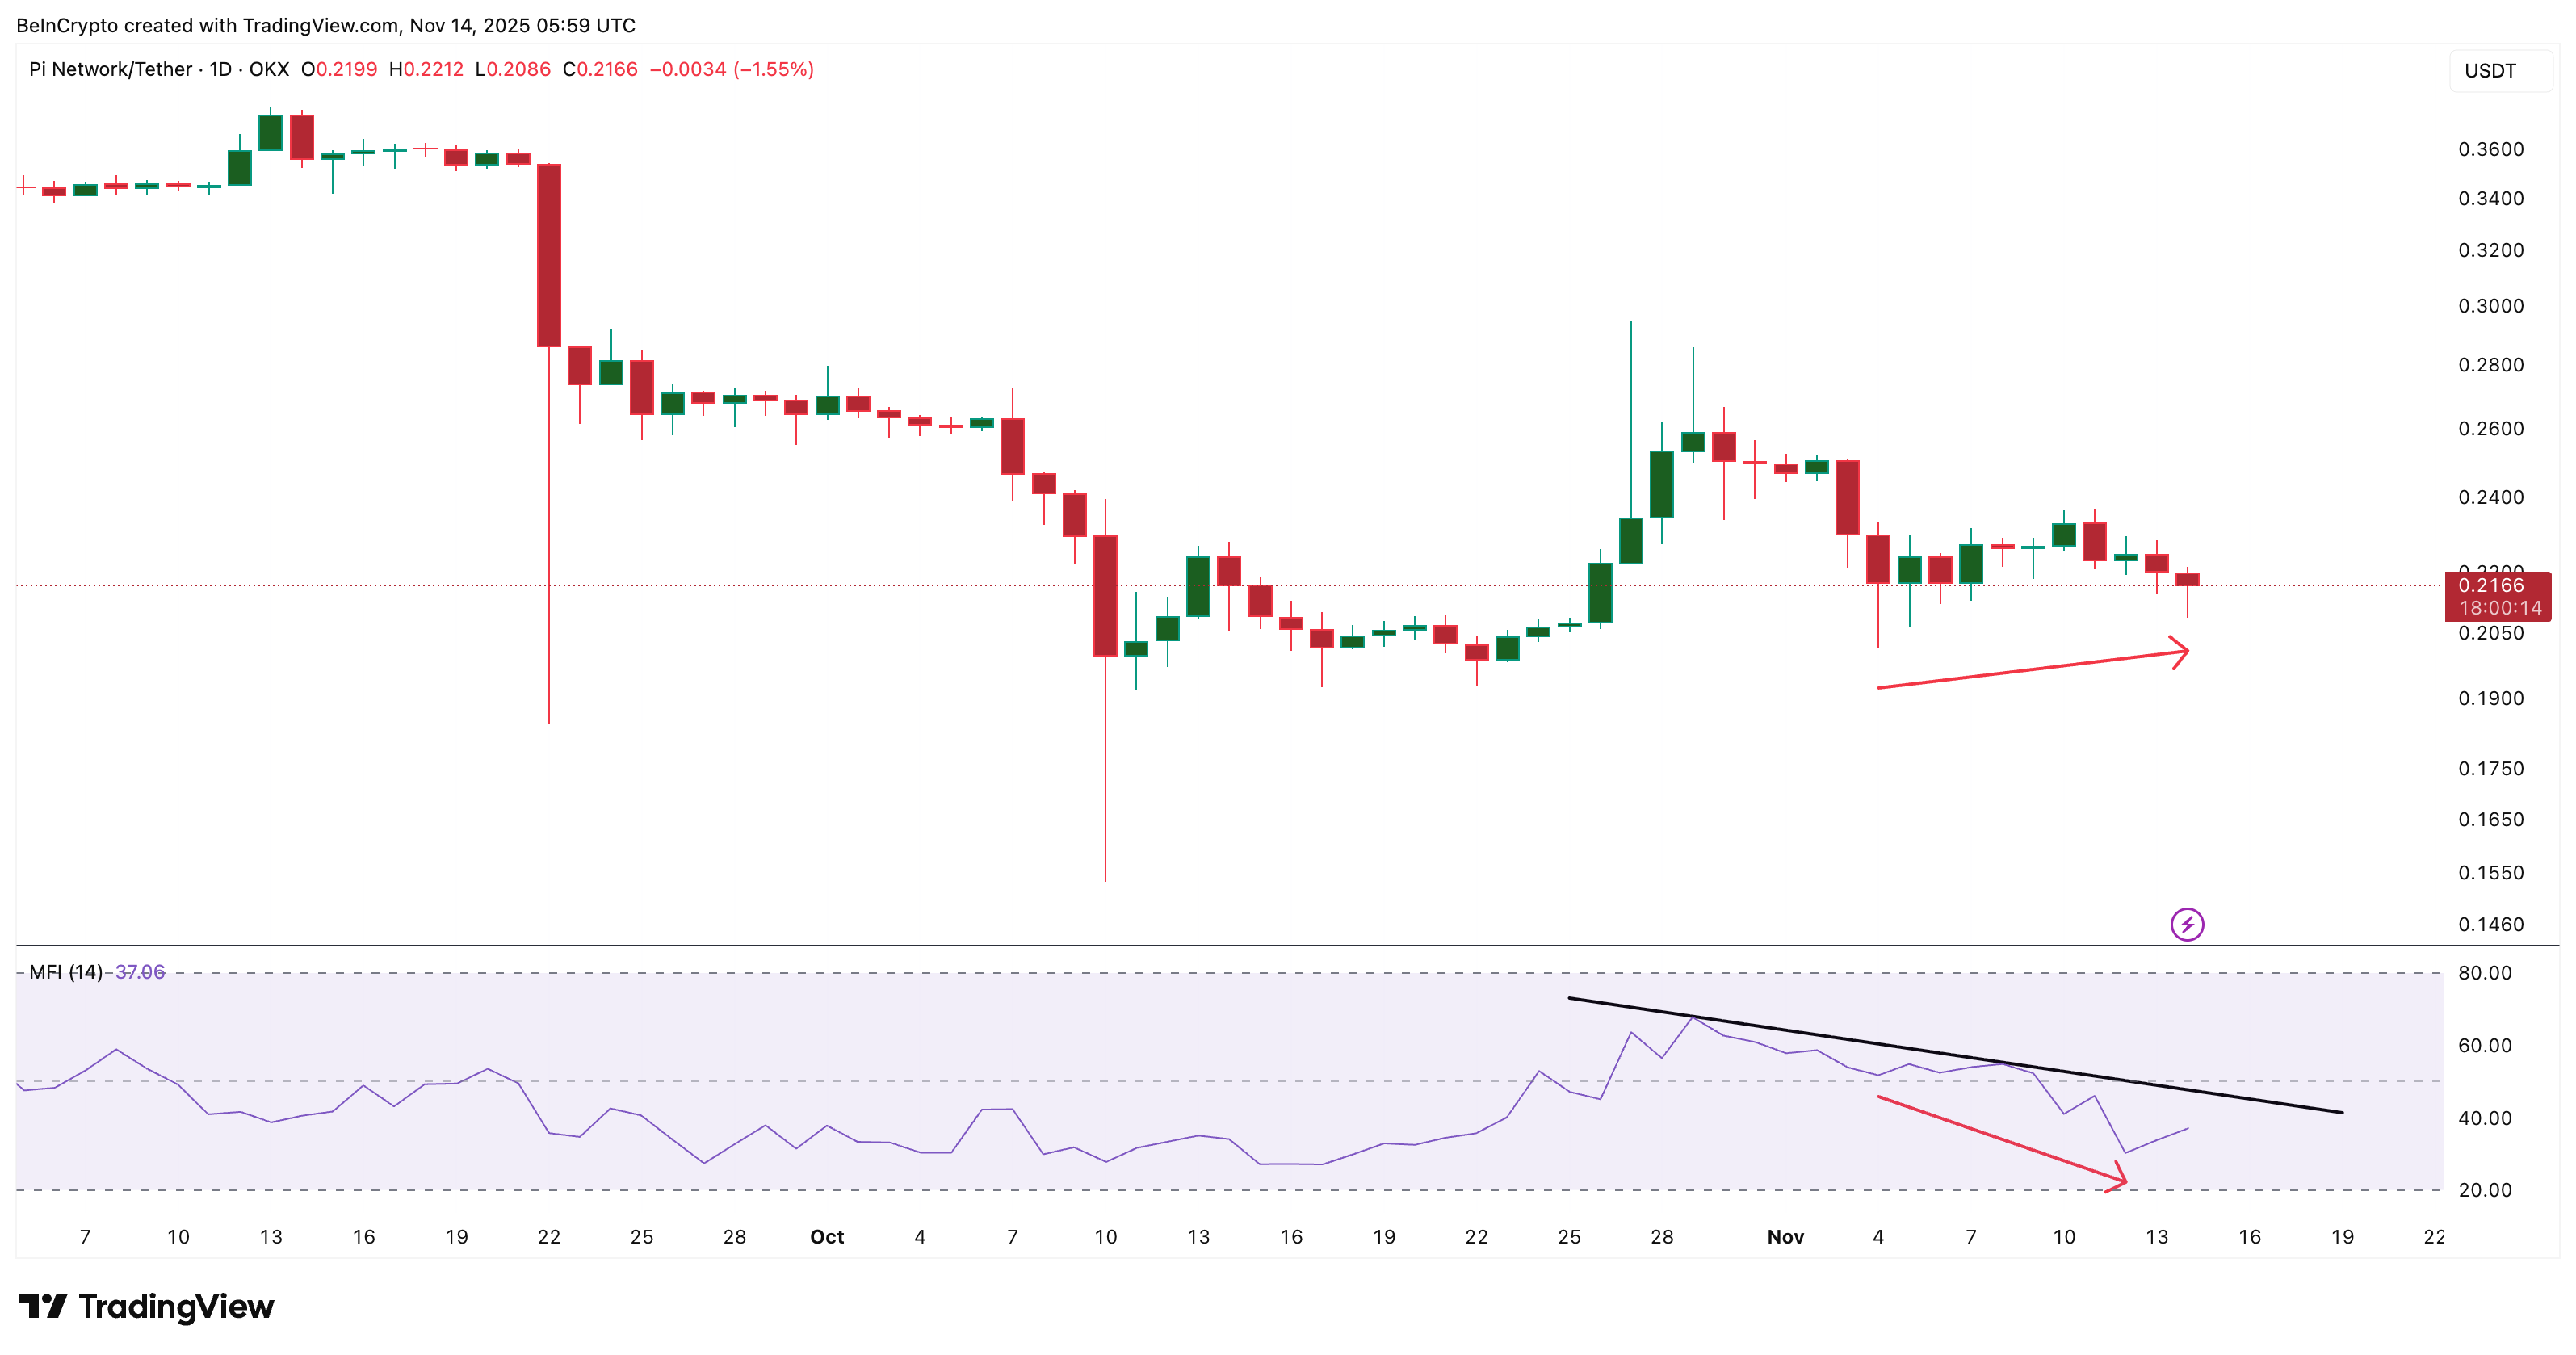
The Money Flow Index (MFI), which tracks whether money is entering or leaving an asset by combining price and volume, has been rising since November 12. Even during the latest three-day dip, MFI did not fall; instead, it continued to push upward and stayed above its recent lows.
This means dip-buying exists. People are still stepping in to accumulate Pi Coin whenever the price pulls back, and the interest is not fake.
 Pi Coin Buyers Exist:
TradingView
Pi Coin Buyers Exist:
TradingView
But if you look at the broader pattern, the MFI is still moving under the trendline and has made a lower low (when Pi Coin price made higher lows) since November 4. This bearish divergence means that the dip buying pressure is there, but weak.
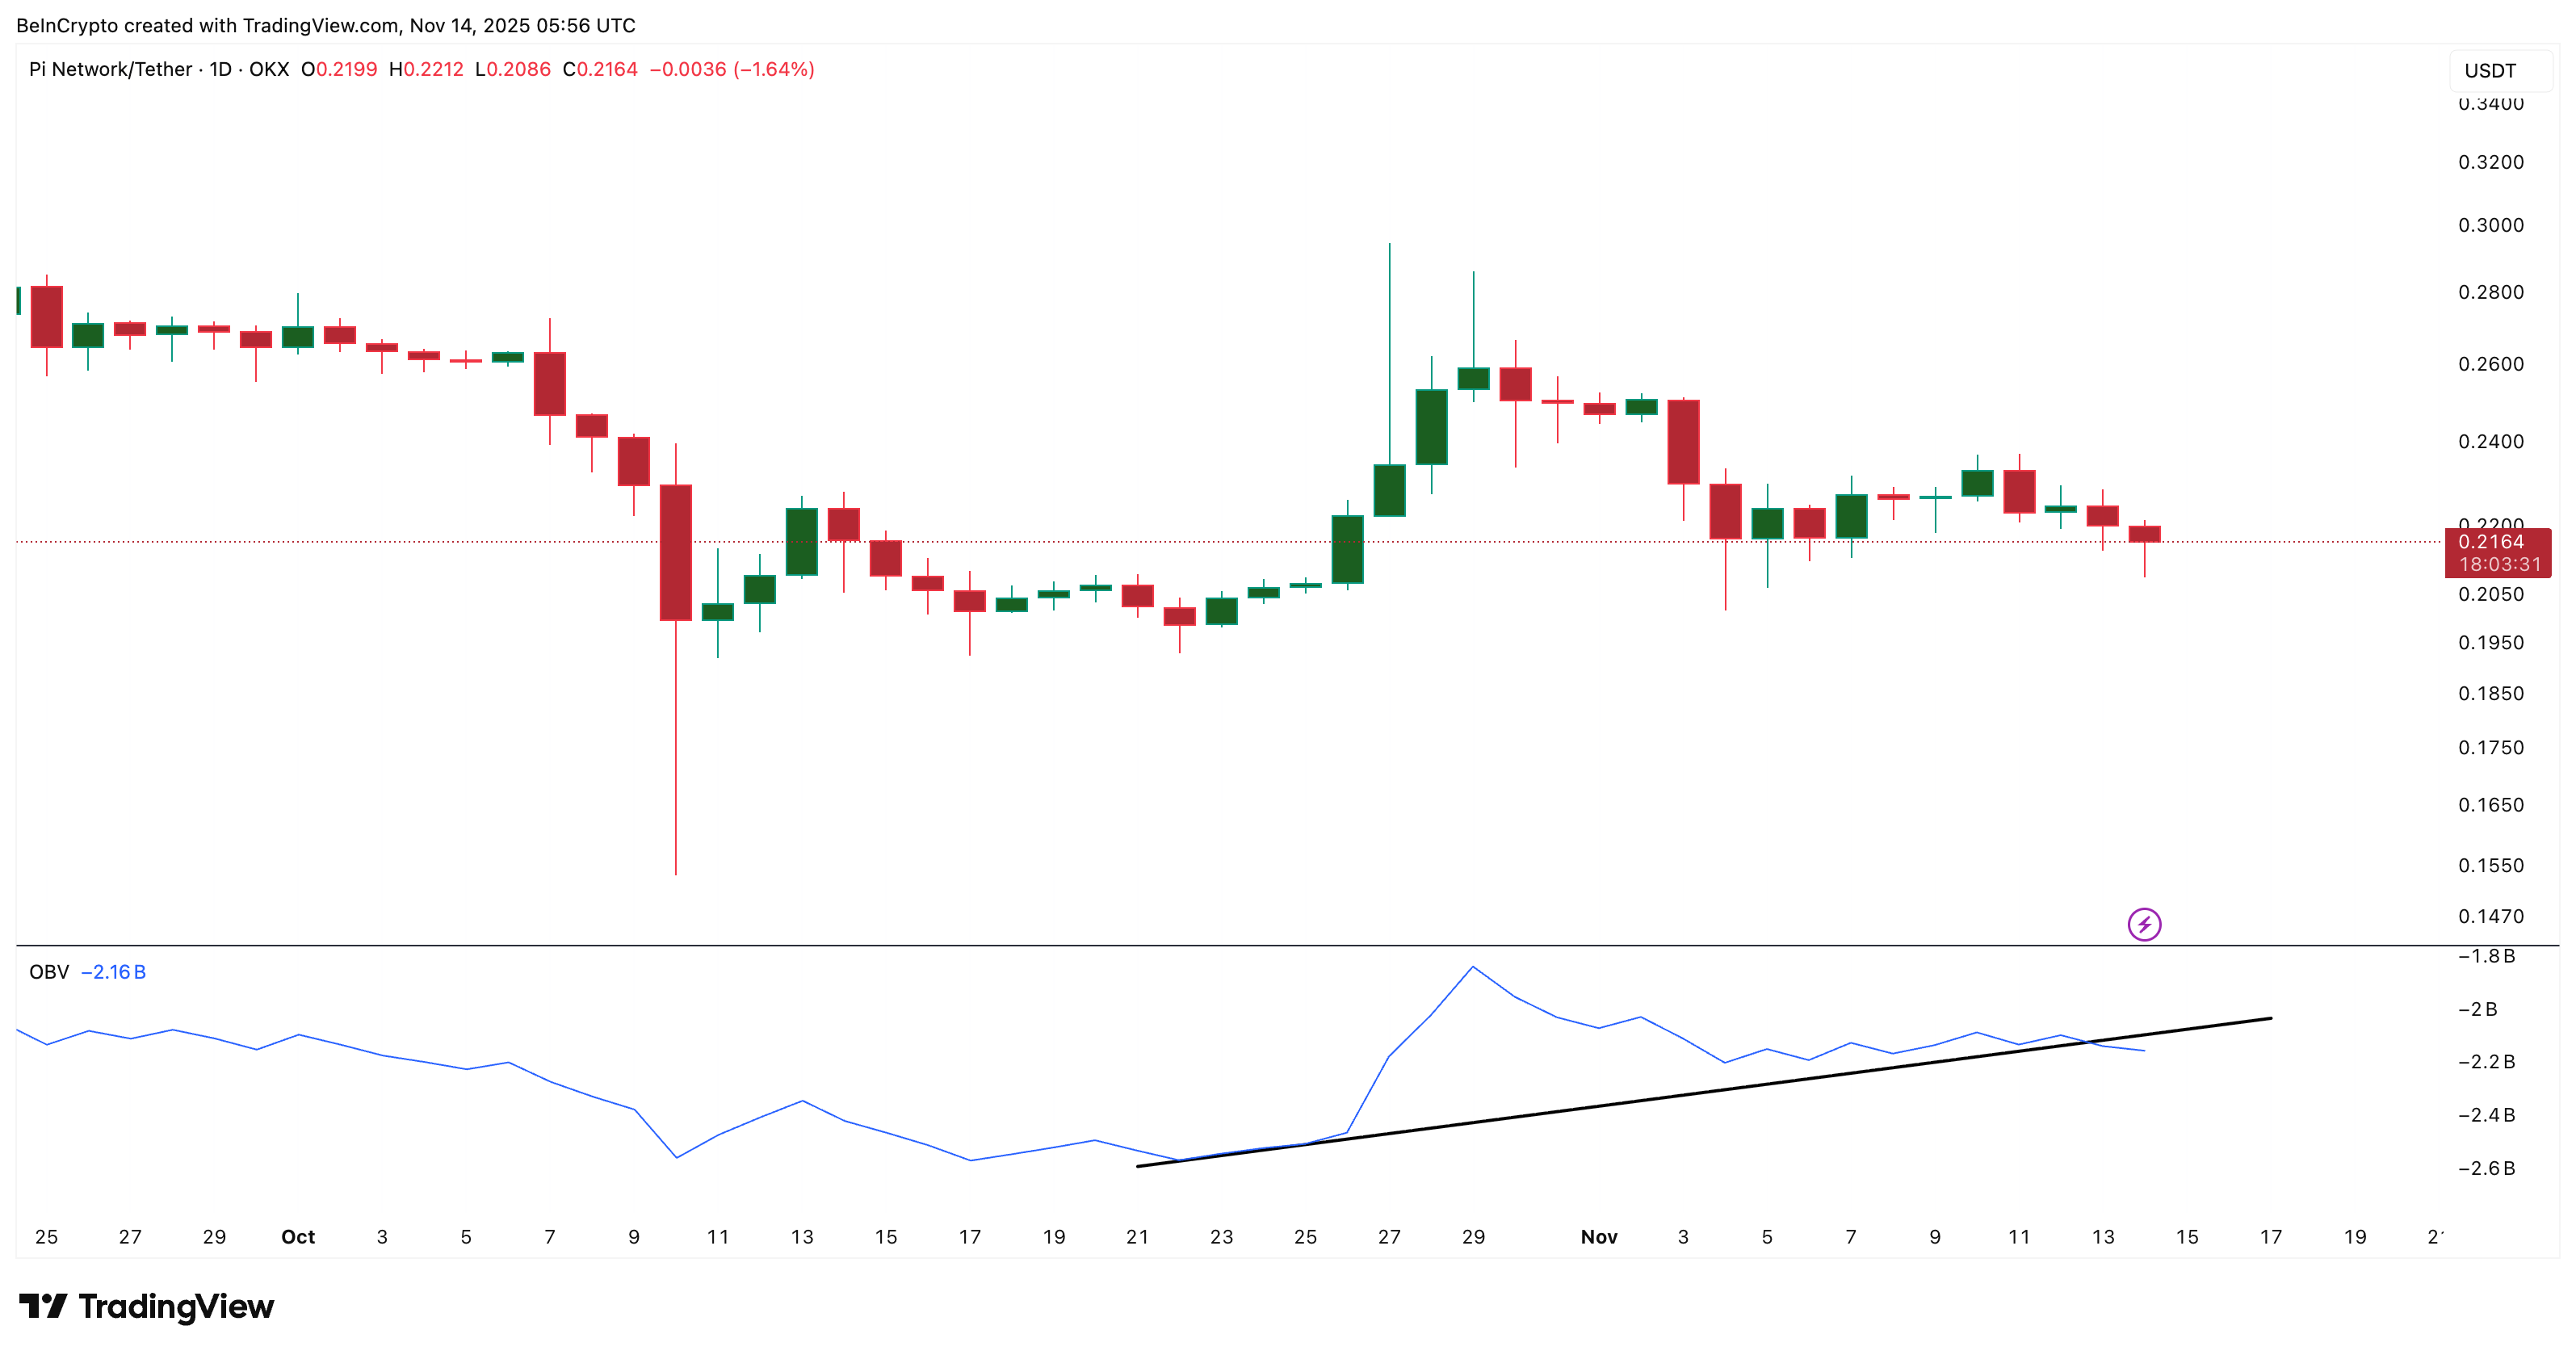
And when we place MFI next to On-Balance Volume (OBV), the picture becomes clearer.
OBV measures whether volume is flowing in on green candles or red candles. It broke below its rising trendline from October 22. That breakdown matters because it shows that the buyers are present, but not strong enough to lift the market. And the buying pressure is gradually weakening.
 Lack Of Volume Is An Issue:
TradingView
Lack Of Volume Is An Issue:
TradingView
MFI says dip-buying exists. OBV says the buying isn’t strong. The gap between these two is the core warning in the chart. It tells us buyers want PI, but they are not backing it with enough volume for the move to turn into a real push higher.
Key Pi Coin Price Levels Show Why Buyers Might Not Be “Smart” Enough
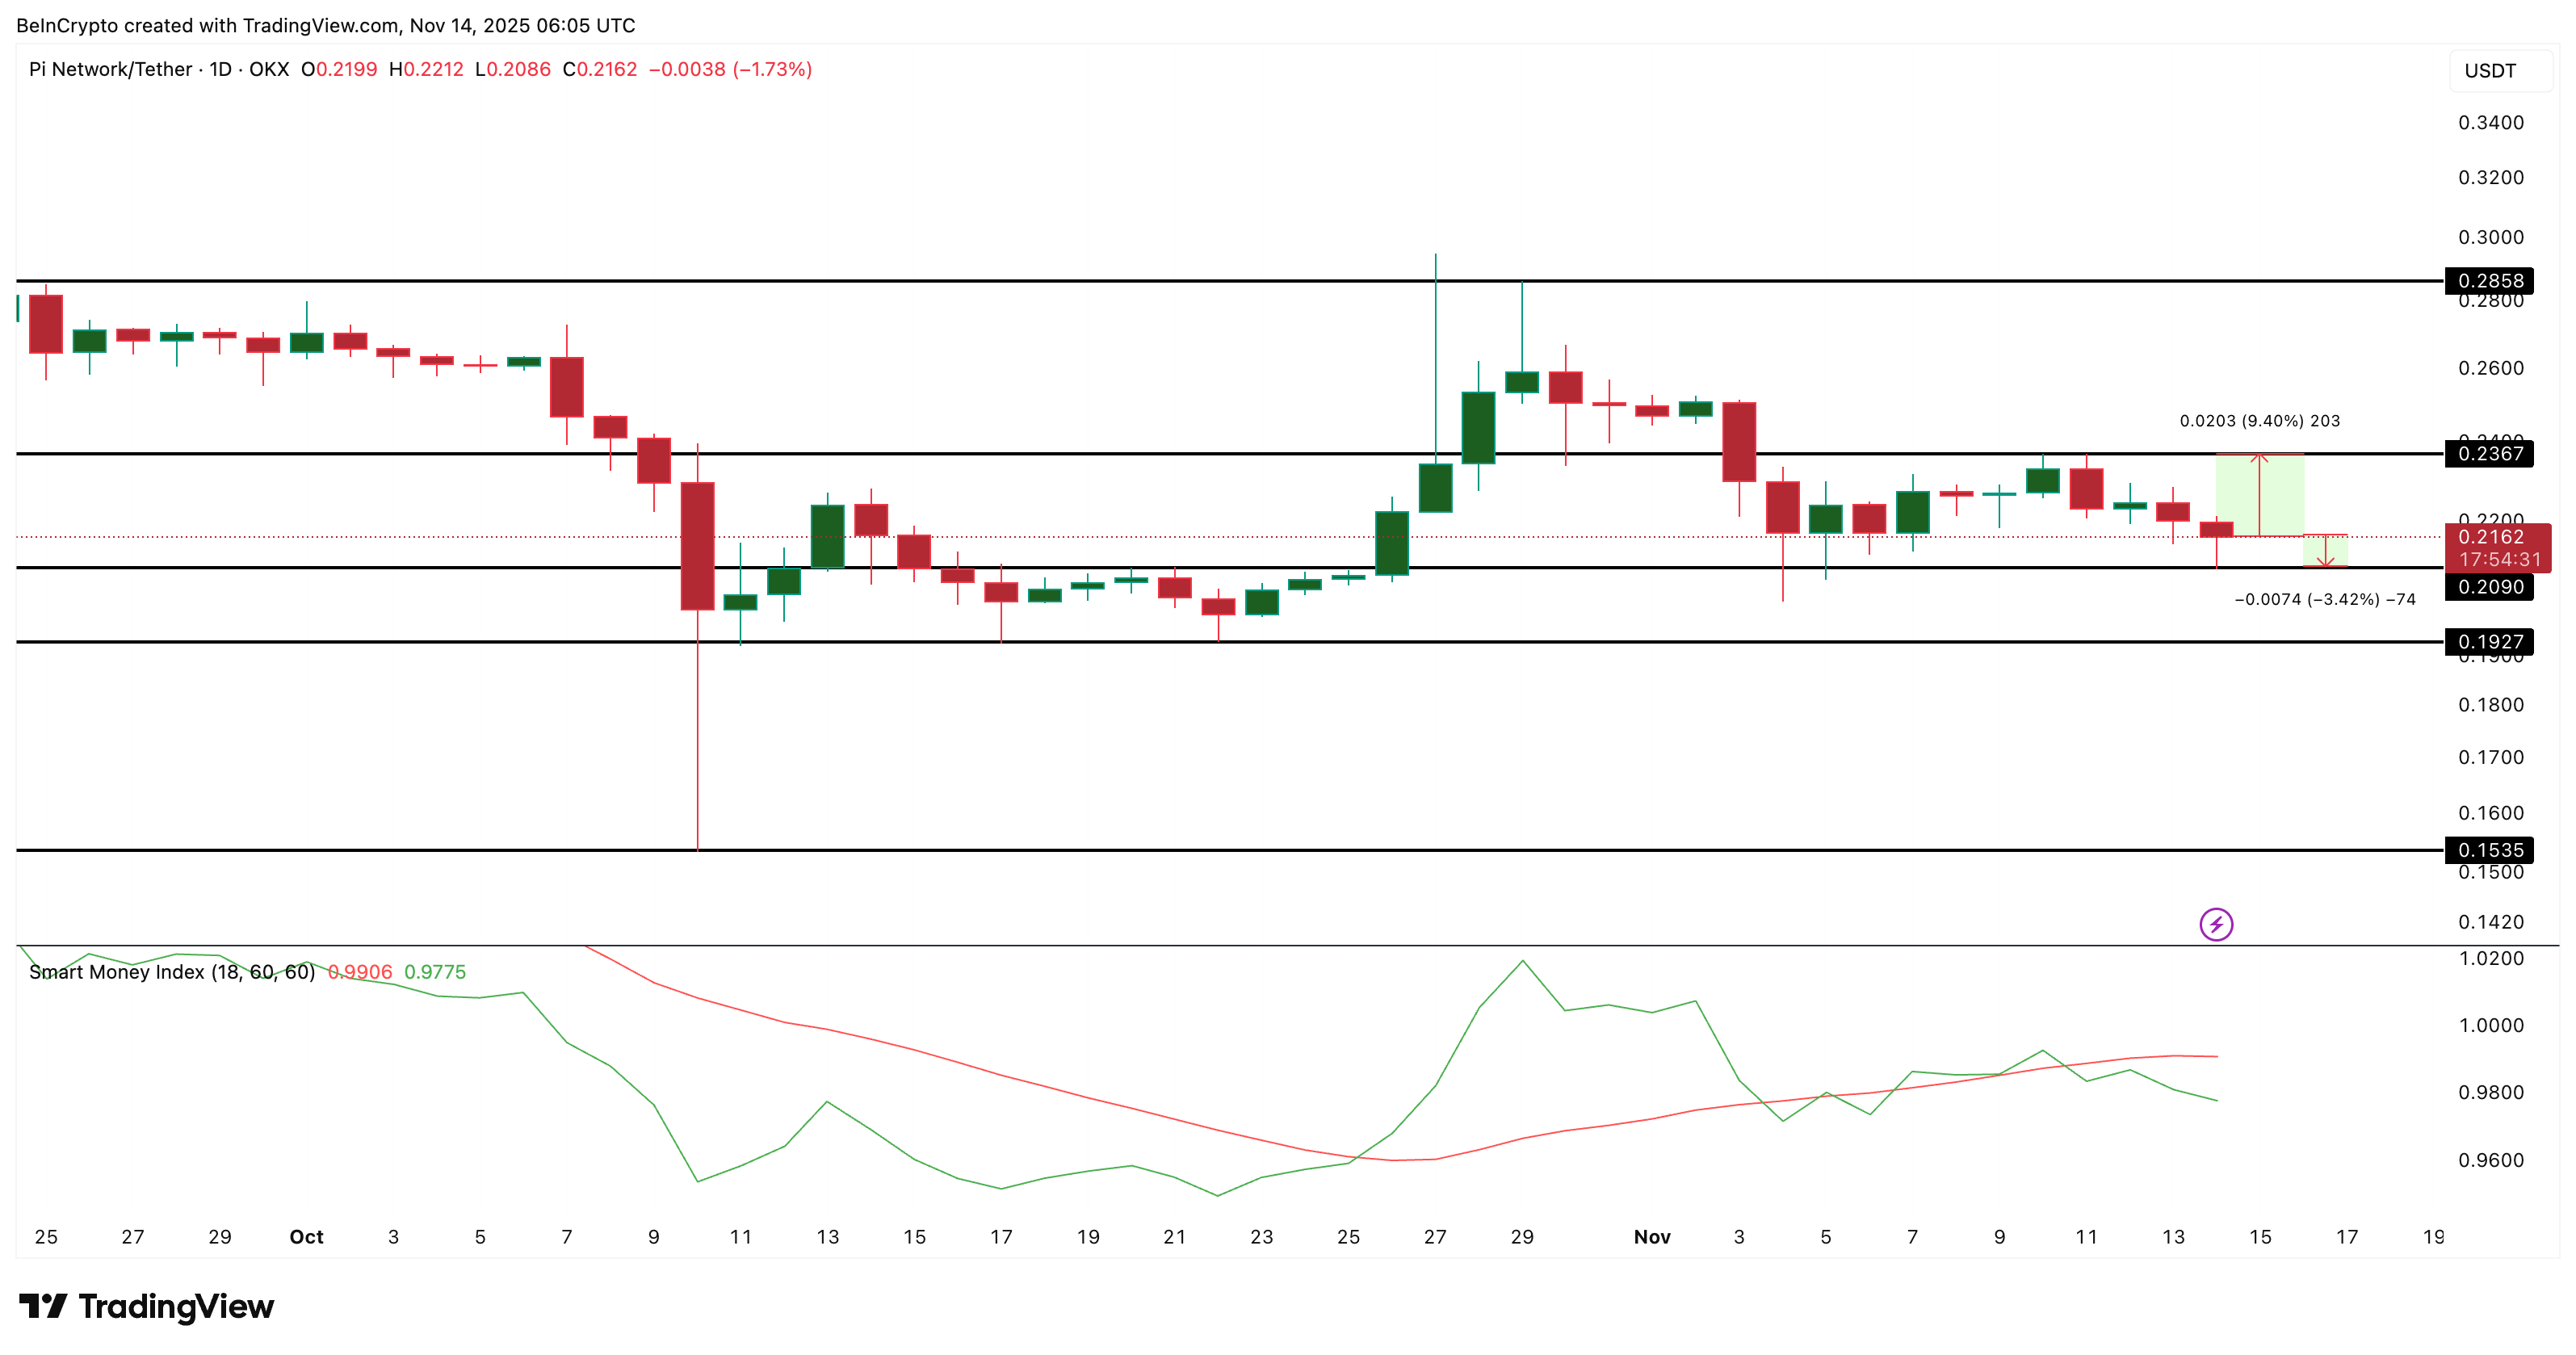
The Pi Coin price chart adds the next layer. PI sits near $0.209, a support level with several past reactions. If this level breaks, sellers have room to push toward $0.192 and even $0.153.
The near-term downside risk from here is roughly 3%. On the other hand, reclaiming strength means first clearing $0.236. That level has repeatedly capped rebounds, and breaking it would open the door to about 9% upside toward $0.285.
So the setup is tight. PI has a shallow downside near $0.209 and the potential for a larger upside if it can break resistance. At a glance, this might look balanced — but the Smart Money Index changes the equation.
The Smart Money Index tracks how informed, patient traders position themselves. When the index rises, it shows stronger hands are buying. When it falls, it signals hesitation.
 Pi Coin Price Analysis:
TradingView
Pi Coin Price Analysis:
TradingView
Right now, the Smart Money Index is not rising with the PI price. Instead, it has started moving away from the signal line. It shows that the more informed group is not betting on a strong rebound.
This matches the weak OBV reading and goes against the small rise in MFI. In simple terms: buyers exist, but the “smart” side of the market isn’t supporting them.
That is why the downside move of over 3% for the Pi Coin price looks more likely. Only a push above $0.236 invalidates the bearishness. But that would need the MFI indicator crossing above the descending trendline.
Disclaimer: The content of this article solely reflects the author's opinion and does not represent the platform in any capacity. This article is not intended to serve as a reference for making investment decisions.
You may also like
Mining Bitcoin : The United States Suspect Bitmain of Espionage

PENGU Price Forecast: Could This Signal the Beginning of a Fresh Market Cycle?
- Pudgy Penguins (PENGU) surged to $0.0316 in Q4 2025 driven by the Pudgy Party game's NFT utility and institutional inflows. - Technical analysis highlights $0.045 as a critical breakout level, with bullish indicators like TD Sequential and MACD signaling momentum. - Regulatory risks persist due to USDT dependency and exposure to U.S. GENIUS Act/EU MiCA, complicating long-term valuation clarity. - Whale accumulation and 33% trading volume surge suggest strategic positioning, though Bitcoin volatility and
SEC’s December Roundtable to Explore Crypto Privacy and Financial Surveillance
Astar (ASTR) Price Rally: On-Chain Usage and Institutional Engagement Fuel Lasting Expansion
- Astar (ASTR) surged 40% in late 2025 driven by on-chain adoption and institutional investments. - Q3 2025 saw 20% growth in active wallets and $2.38M TVL, supported by Agile Coretime upgrades and 150,000 TPS cross-chain infrastructure. - A $3.16M institutional investment and Astar 2.0's EVM compatibility highlight its multichain infrastructure vision and technical maturity. - Strategic partnerships with Animoca Brands and Sony Soneium, plus Chainlink CCIP integration, strengthen Astar's interoperability