Date: Mon, Nov 24, 2025 | 05:25 AM GMT
The cryptocurrency market is starting the week with a sense of relief after last week’s turbulence, which dragged Ethereum (ETH) down to a low of $2624 before recovering above $2875. Despite recent volatility, ETH’s weekly chart is now hinting at a potentially powerful recovery setup driven by a developing harmonic structure.
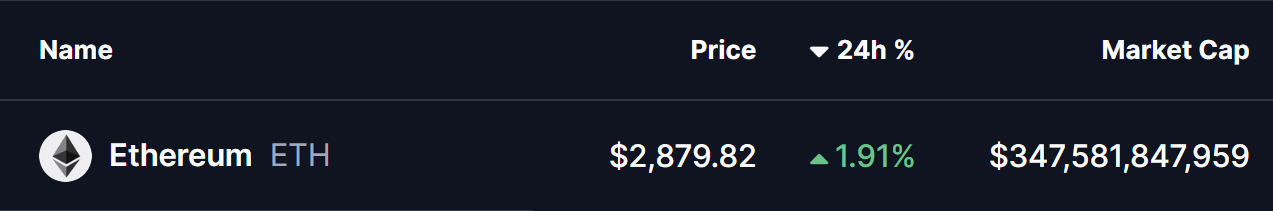 Source: Coinmarketcap
Harmonic Pattern Hints at Potential Bounce
On the weekly timeframe, Ethereum appears to be forming a potential Bearish ABCD harmonic pattern. This classical structure generally indicates a strong upside movement during the CD leg—typically where price accelerates until reaching the final reversal area known as the Potential Reversal Zone.
The pattern formation started at Point A near $2188.98, followed by a significant rally to Point B. After that, ETH entered a steep correction phase into Point C at $2624.88. This C-leg is proving meaningful, as early buying pressure has already pushed price back above $2875. This level now acts as a critical structural support, reinforcing the idea that ETH may be beginning its CD-leg advance.
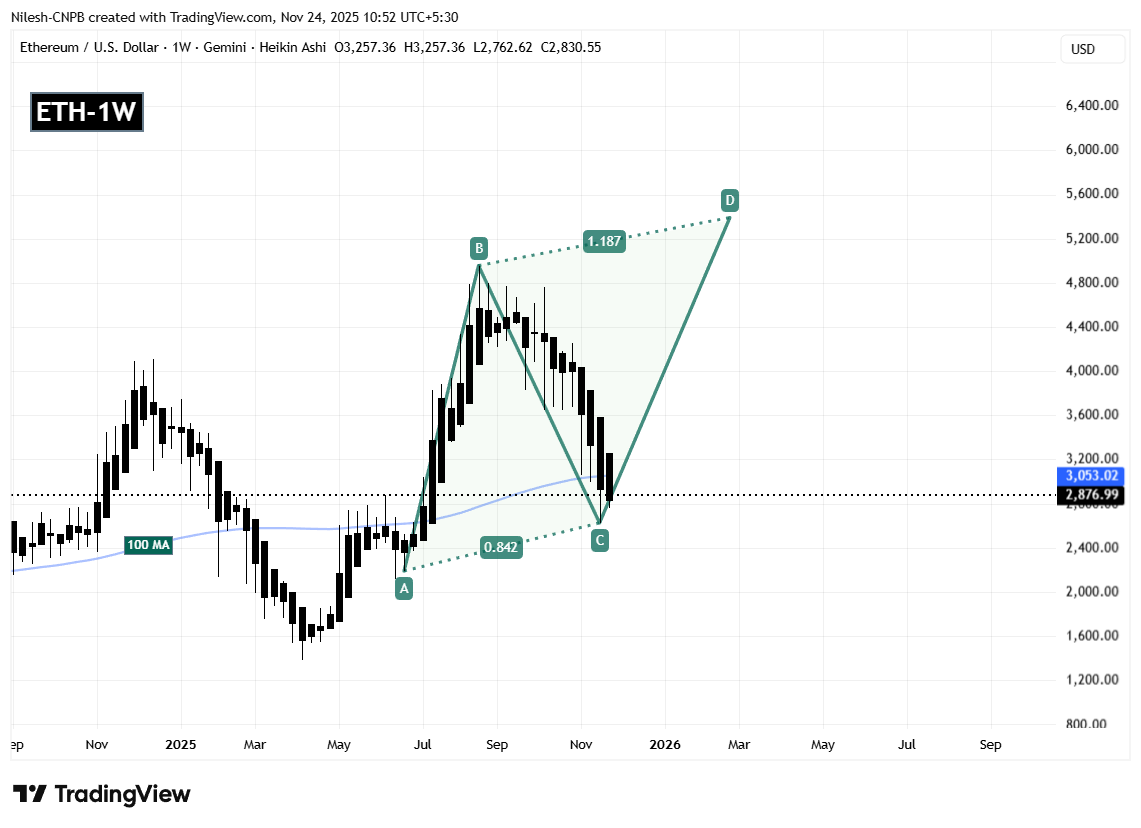 Ethereum (ETH) Weekly Chart/Coinsprobe (Source: Tradingview)
Another key technical factor supporting this outlook is the reclaim attempt above the 100-week moving average, currently sitting at $3053. Holding and closing above this level may serve as a strong signal that bullish momentum is returning.
What’s Next for ETH?
If buyers continue defending the $2624.88 support and ETH sustains movement above the 100-week MA, the next major objective lies near the Potential Reversal Zone aligned with the 1.187 Fibonacci extension. The projected completion area of the harmonic pattern sits near approximately $5391.87, which represents nearly an 86% potential upside from current price levels.
However, traders should remain cautious. A breakdown below $2624.88 would compromise the harmonic structure and potentially trigger deeper retracement before any meaningful bullish recovery occurs. Market participants will be closely watching weekly closes and reaction zones to gauge direction.