Shiba Inu’s charts now flash a textbook bearish flag with a measured move that points about 51 percent lower, even as a fresh intraday wedge sketches a possible rebound from key support.
The clash between higher-time-frame downside signals and short-term recovery patterns sets the stage for SHIB’s next decisive move.
SHIB Breaks Into a Bearish Flag That Signals a Steep Measured Move
Shiba Inu’s chart shows a clear bearish flag structure forming after a sharp downward impulse.
The recent breakdown through the lower boundary now places the pattern in a confirmation phase.
The flag began with the long red candle shown near the center of the chart, which created the flagpole.
Then price drifted upward and sideways inside two downward-sloping parallel lines, forming the flag body.
SHIB Bearish Flag Breakdown. Source: TradingViewAt the same time, the breakout occurred below the lower trendline of the channel.
The candle moved under the line and continued closing beneath it, which is the technical signal analysts use to confirm bearish continuation.
The RSI reading near 31 shows weak momentum and aligns with the pattern’s structure.
The slope of the 50-day EMA above the price also reflects persistent downside pressure.
The measured move of a bearish flag comes from the height of the flagpole. In this chart, the pole spans from about 0.00001280 down toward roughly 0.00000800.
This creates a pole of approximately 51 percent. When the structure confirms, technicians project the same distance downward from the breakout zone.
Because the breakdown occurred near 0.00000790, a full 51 percent extension targets the 0.00000385 to 0.00000390 zone.
Meanwhile, the chart also highlights support layers that sit before this full target. Levels appear around 0.00000567 and 0.00000366.
Price could pause near these bands, yet the pattern’s complete projection still aligns with the region below 0.00000400.
The long downward sloping line drawn across the chart shows how this measured target intersects with broader trend pressure.
Overall, the chart structure, the breakout location, the EMA trend, and the RSI level all fit the definition of a confirmed bearish flag.
After confirmation, the textbook drop extends the pole length from the breakdown point, which in this case implies about a 51 percent decline from 0.00000790 toward roughly 0.00000385.
SHIB MACD Slides Deeper Into Negative Territory as Momentum Weakens
Shiba Inu’s MACD now shows a clear bearish alignment as both the MACD line and the signal line move further below the zero axis.
The latest bars on the histogram extend in red, which reflects strengthening downward momentum after the recent breakdown on the main chart.
The widening gap between the two lines confirms that selling pressure continues to dominate the trend.
SHIB MACD Momentum. Source: TradingViewAt the same time, the MACD lines remain in a downward slope with no sign of a bullish crossover forming.
The blue MACD line sits well under the orange signal line, which indicates that buyers have not attempted to reverse the momentum yet.
This posture usually appears during sustained downtrends when the price keeps failing to recover above resistance zones.
Meanwhile, the fading green bars seen earlier in November now transition into deeper red tones. This shift shows how quickly momentum flipped back to the downside.
Together with the broader bearish flag breakdown on the price chart, the MACD reading supports continuation signals rather than recovery signals at this stage.
Meanwhile, a New SHIB Setup Highlights a Narrow Reversal Window
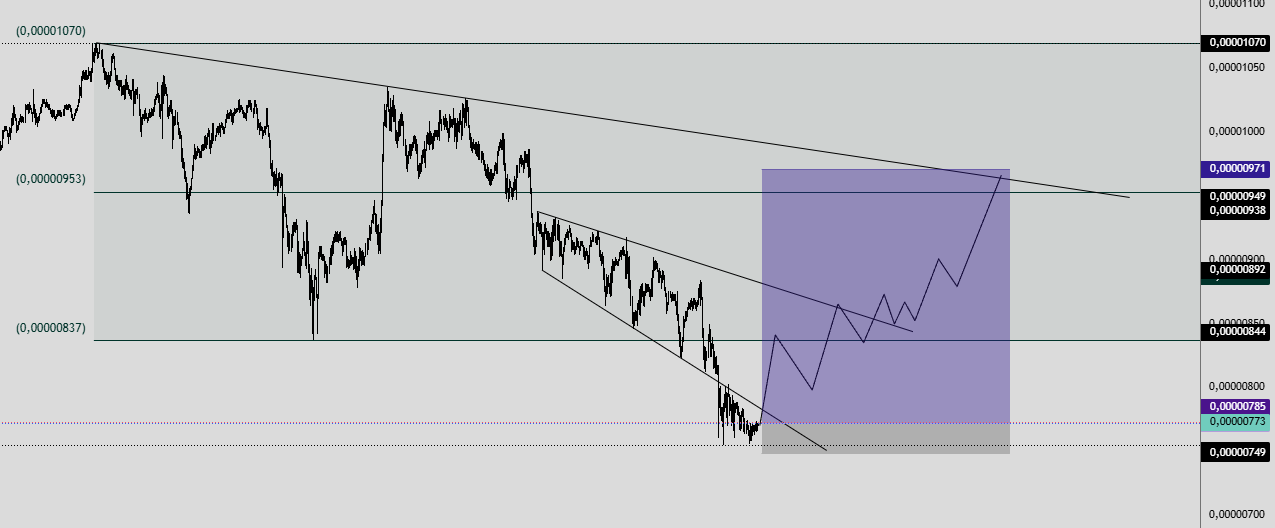
Shiba Inu’s short-term chart shows price stabilizing inside a descending wedge as intraday traders map a potential rebound path.
The structure forms after a steady series of lower highs and lower lows, while the lower boundary compresses price into a tight zone near 0.00000773 to 0.00000749.
This area holds as the key support band that traders are watching for a break or a reaction.
 SHIB Intraday Reversal Setup. Source: TradingView / X
At the same time, the projection box on the chart outlines a possible recovery route if SHIB holds this support.
The path sketched inside the shaded zone reflects a sequence of higher lows and controlled pullbacks, which matches typical wedge-break behavior when momentum shifts.
The first horizontal checkpoint appears around 0.00000844, where past trading activity created a reaction shelf that may act as early resistance.
Meanwhile, the broader move still faces the long descending trendline that stretches from the 0.00001070 peak.
The purple zone extends toward the 0.00000971 region, which marks the next major resistance cluster.
For SHIB to confirm a reversal, price needs to exit the wedge, reclaim the mid-range near 0.00000892, and then test the upper boundary. Until that happens, the setup remains a watch zone rather than a confirmed trend change.

Editor at Kriptoworld
Tatevik Avetisyan is an editor at Kriptoworld who covers emerging crypto trends, blockchain innovation, and altcoin developments. She is passionate about breaking down complex stories for a global audience and making digital finance more accessible.
📅 Published: November 24, 2025 • 🕓 Last updated: November 24, 2025