Solana’s ( SOL ) onchain flows are flashing a powerful supply-side shift with the crypto asset hovering just above the $120 support zone, but market participation still needs to intensify to turn this structural advantage into upside momentum.
Key takeaways:
$2.12 billion USDC flowed into Binance while $1.11 billion SOL exited, forming a textbook bullish structure around the $120 level.
SOL futures volume fell 3% while BTC and ETH saw 43% and 24% jumps, signaling sluggish trader participation despite improving spot mechanics.
Relative unrealized profit retreated to October 2023 lows, indicating a marketwide profitability reset similar to prior accumulation phases.
Stablecoin inflows, SOL supply crunch underpin $120 floor
Last week, Solana witnessed a striking liquidity divergence on Binance, with USDC ( USDC ) inflows ballooning to $2.12 billion, while SOL outflows exceeded $1.11 billion. CryptoQuant data indicated that this dynamic is crucial for defending major support levels, including $120, above which the price has been stabilizing.
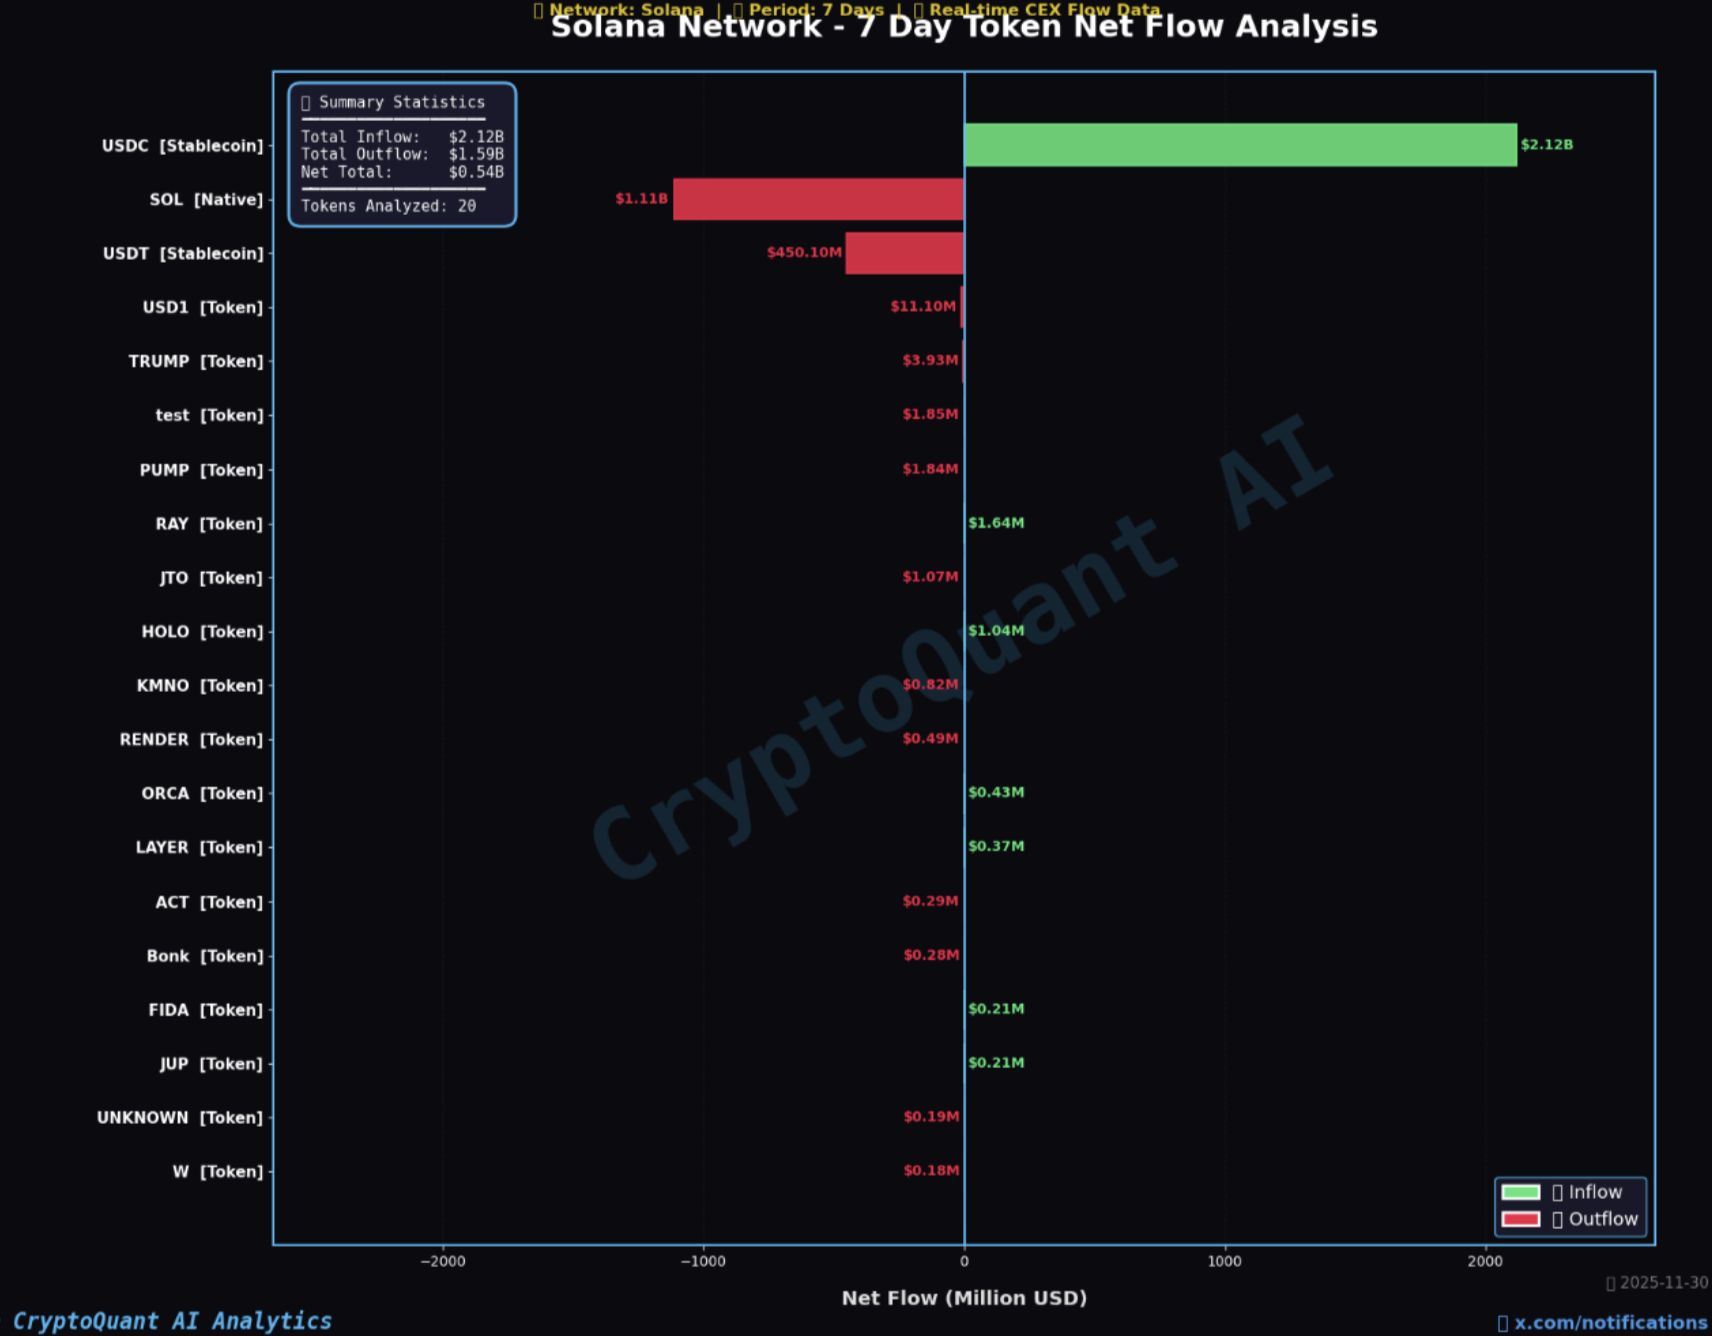 Solana seven-day net flow analysis. Source: CryptoQuant
Large stablecoin inflows typically represent pending buy-side liquidity from whales or institutional entities who are partially sidelined. Meanwhile, native token outflows reduce exchange-side sell pressure, reinforcing the idea of a structural supply crunch.
The fact that USDt ( USDT ) saw a $450 million outflow further underscored a shift toward USDC-driven capital deployment in Solana ecosystems, a trend historically aligned with constructive market behavior.
Despite a tightening supply profile, follow-through demand remains essential. Without active spot buyers stepping in, supply-side strength alone may not sustain broader directional moves.
According to Glassnode’s cost basis distribution heatmap, a large tranche of buyers recently bought about 17.8 million SOL at a cost basis of $142 and another 16 million SOL at $135.
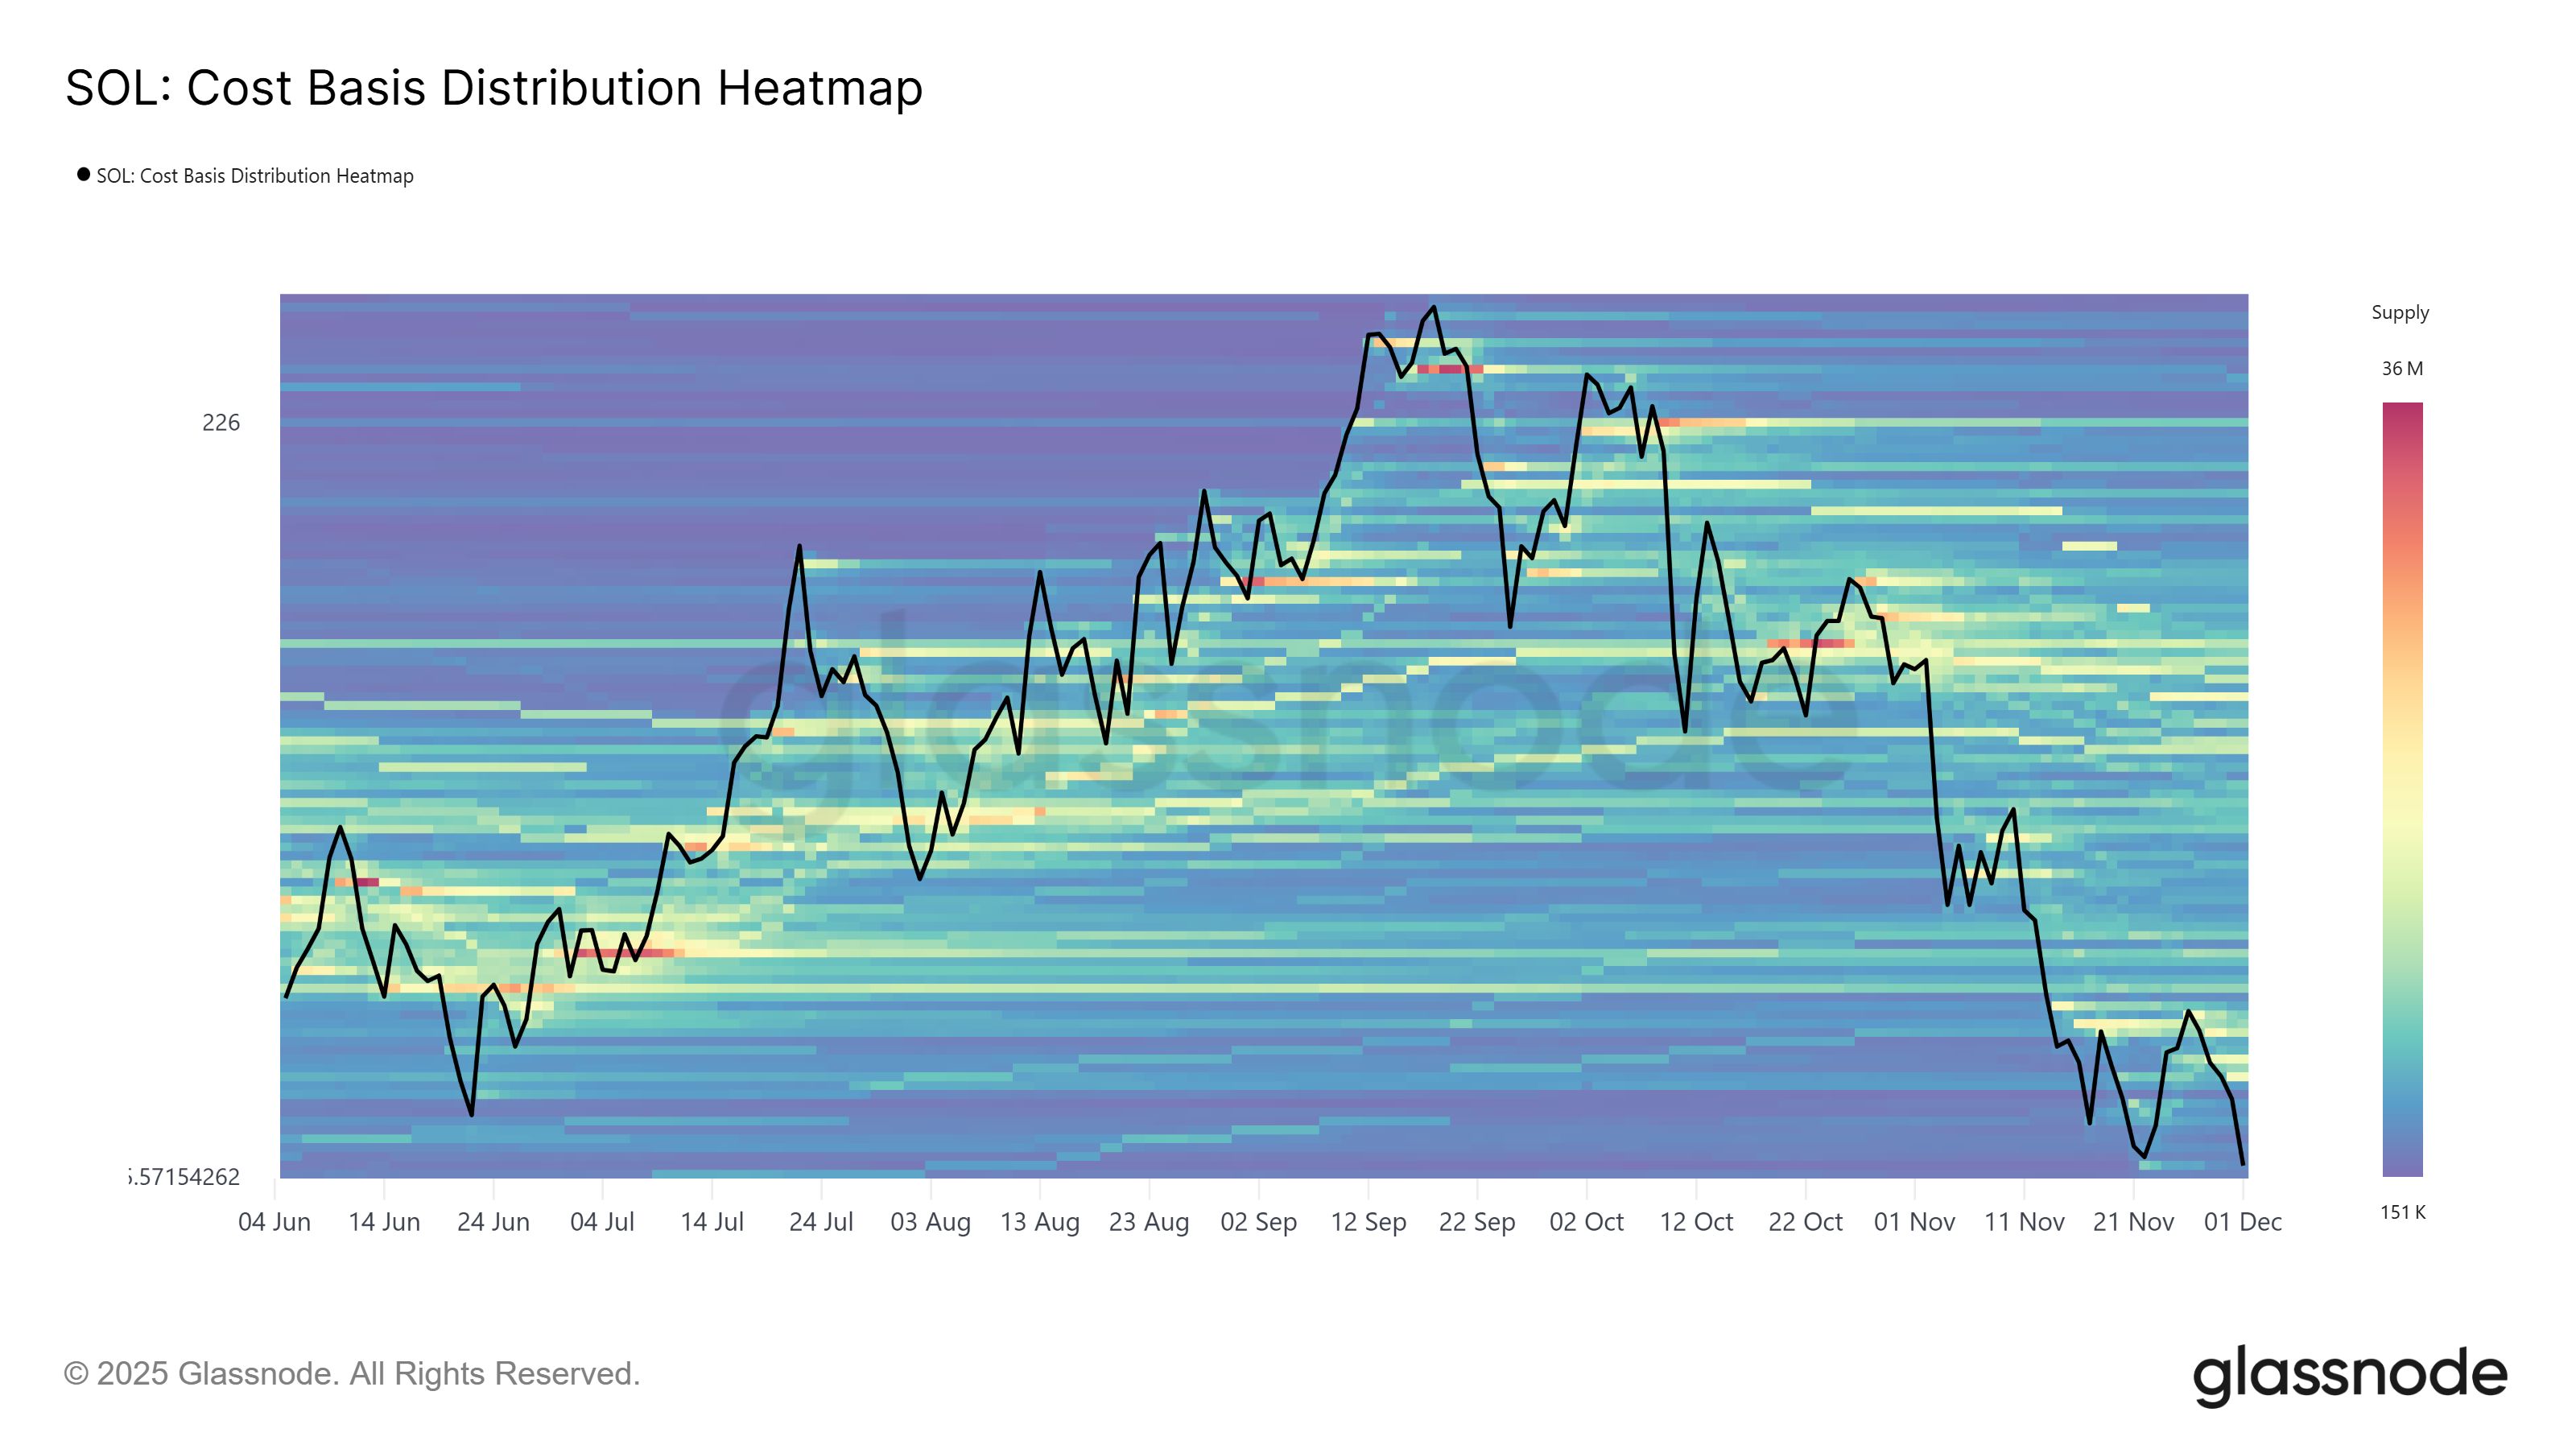 SOL Cost Basis Distribution Heatmap. Source: Glassnode
These clusters act similarly to onchain support and resistance zones:
Large clusters below price leads to strong support, as many holders are either in profit or near breakeven and have an incentive to defend.
Large clusters above price leads to potential resistance, as trapped liquidity may sell into recovery.
Thus, at the moment, SOL needs to reclaim $135 and $142 for the recent buyers to act as strong fundamental support levels.
Related: Digital asset treasury boom stalls as flows drop to $1.3B and stocks tumble
Futures activity stalls while SOL PnL resets
While onchain flows show accumulation, derivatives activity inferred a more cautious environment. SOL futures volume slipped 3%, even as Bitcoin ( BTC ) and Ether ( ETH ) recorded sizable increases of 43% and 24%.
This imbalance suggested SOL traders have been unusually quiet, a contrast to the capital entering ecosystems via stablecoins.
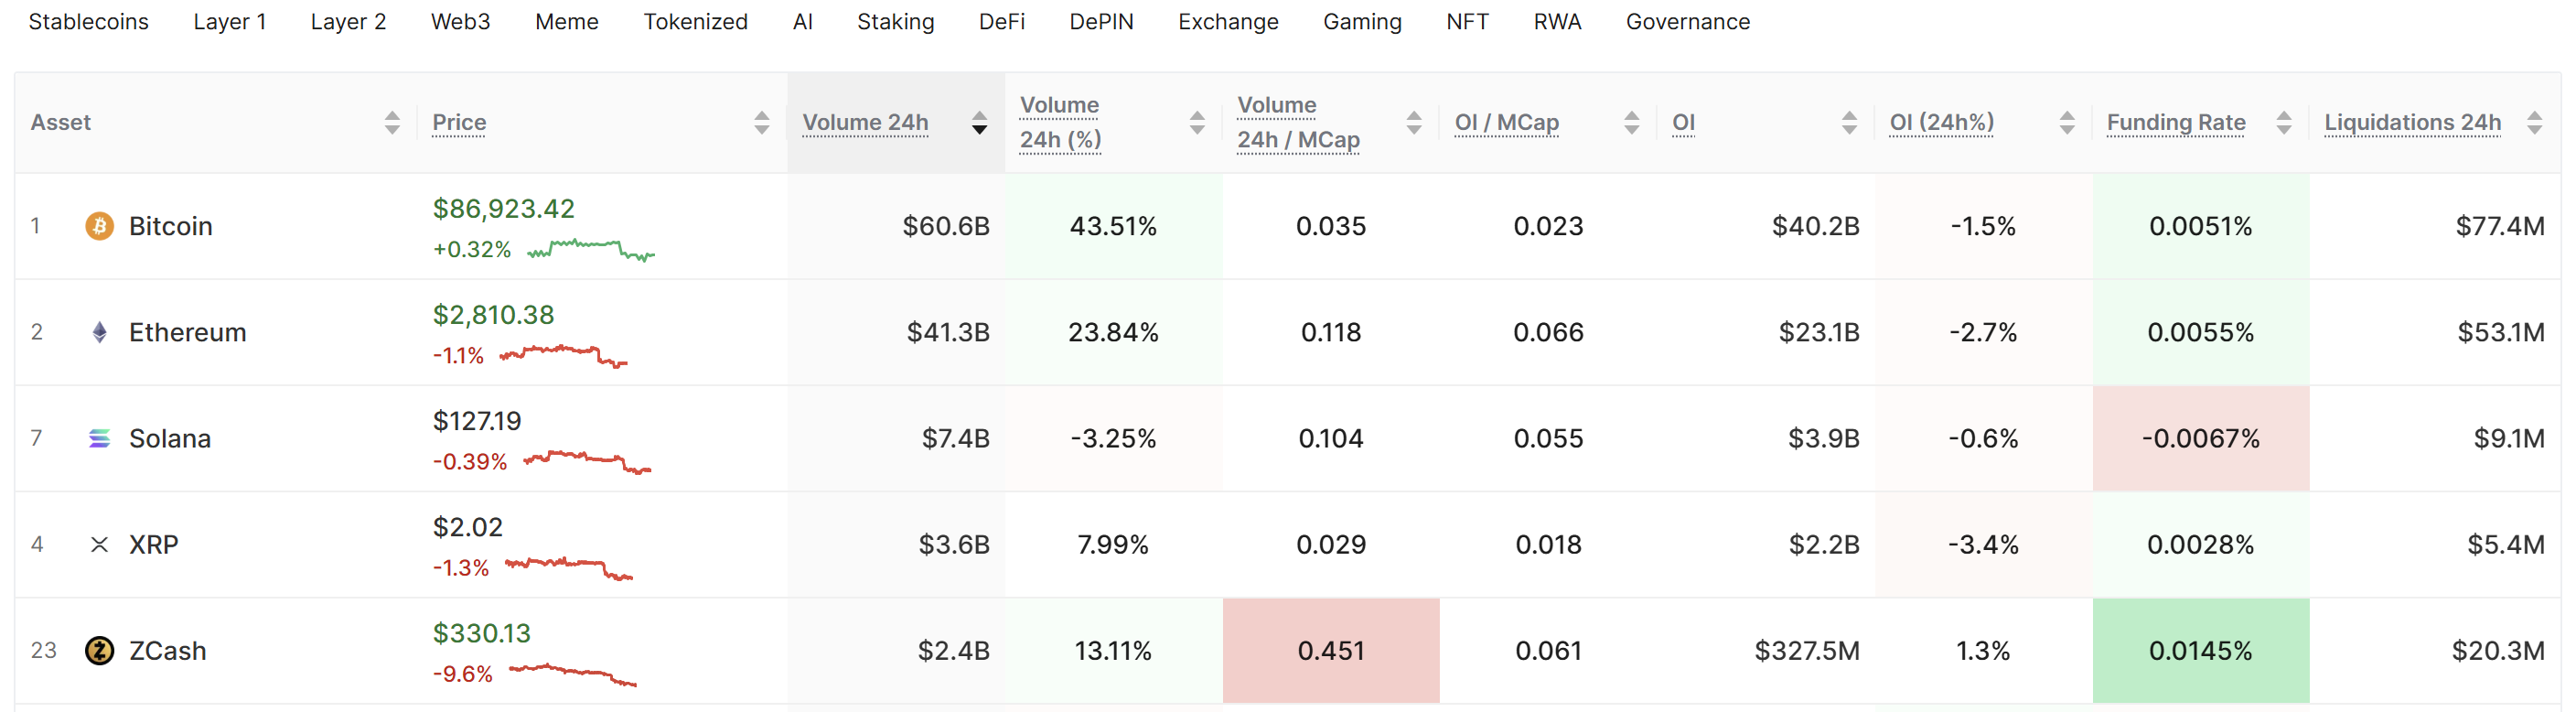 BTC, ETH, and SOL futures data comparison. Source: Glassnode
Meanwhile, relative unrealized profit has dropped to October 2023 levels, when SOL traded near $20. Such profitability resets may imply that speculative excess has been wiped out, leaving the market in an attractive reaccumulation zone.
Net Realized Profit/Loss also printed heavy negative readings in November, mirroring the deep realized losses seen during the February–April 2025 bottom-range formation. Historically, such patterns precede stronger recovery cycles, but traders would need to step back in to convert positioning into upward momentum.
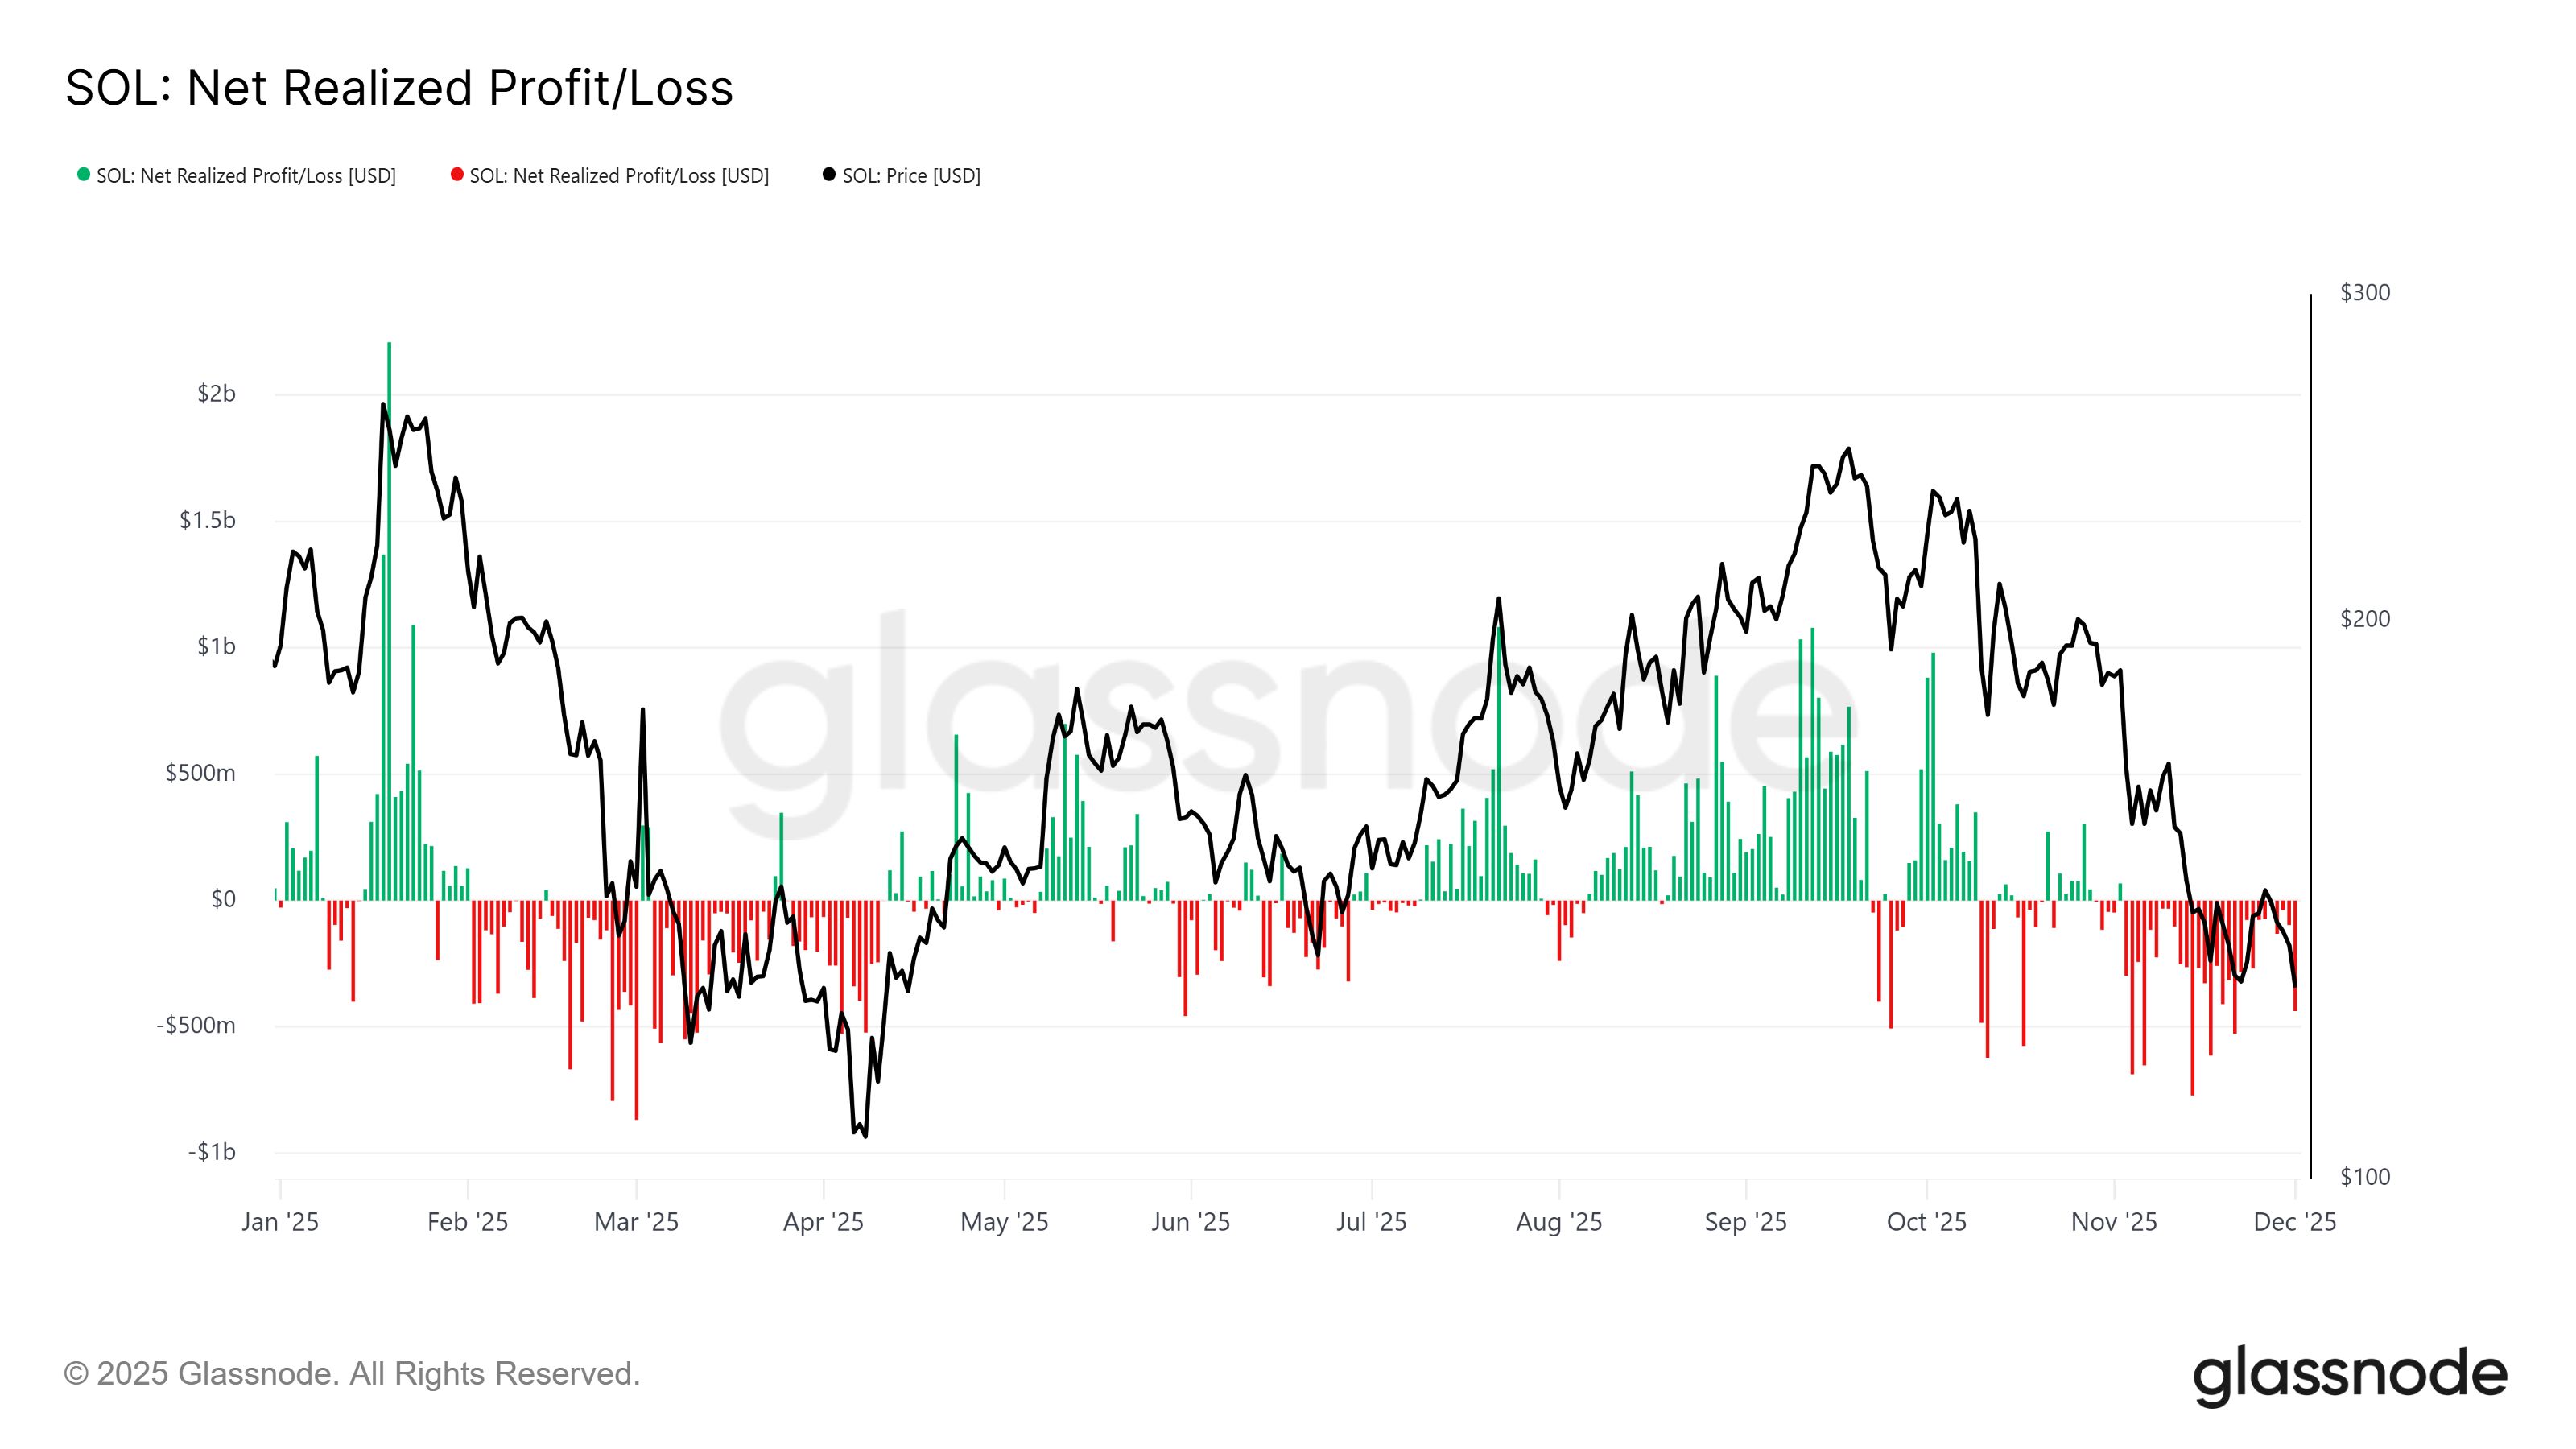 SOL net realized profit/loss. Source: Glassnode
Related: Vanguard’s 50M+ clients will soon have access to crypto ETFs