Bitcoin ( BTC ) gained 5.81% on Tuesday, its biggest daily return since May 8. As the rally unfolded, a bullish engulfing pattern formed, marking the first significant structural shift on the daily chart in the fourth quarter. Traders now wonder if there is an increased chance for a sustained recovery over the coming day.
 Bitcoin one-day chart. Source: Cointelegraph/TradingView
Key takeaways:
Bitcoin printed a bullish engulfing candle with its strongest daily gain since May, signaling early trend expansion.
A daily close above $96,000 is required for full bullish confirmation.
Buy-side trading surged to its highest reading of the entire bull market as the Coinbase Premium flipped positive.
Bitcoin structure improves, but major confirmation lies above $96,000
BTC’s rally on Tuesday established a clear higher high and higher low pattern following Monday’s liquidity sweep below $84,000, implying that sellers are losing momentum. The breakout was supported by strong volume, signaling demand rather than a stop-loss hunt-driven move.
High-volume breakouts tend to produce cleaner follow-through because they reflect aggressive participation from directional buyers, not just passive market makers.
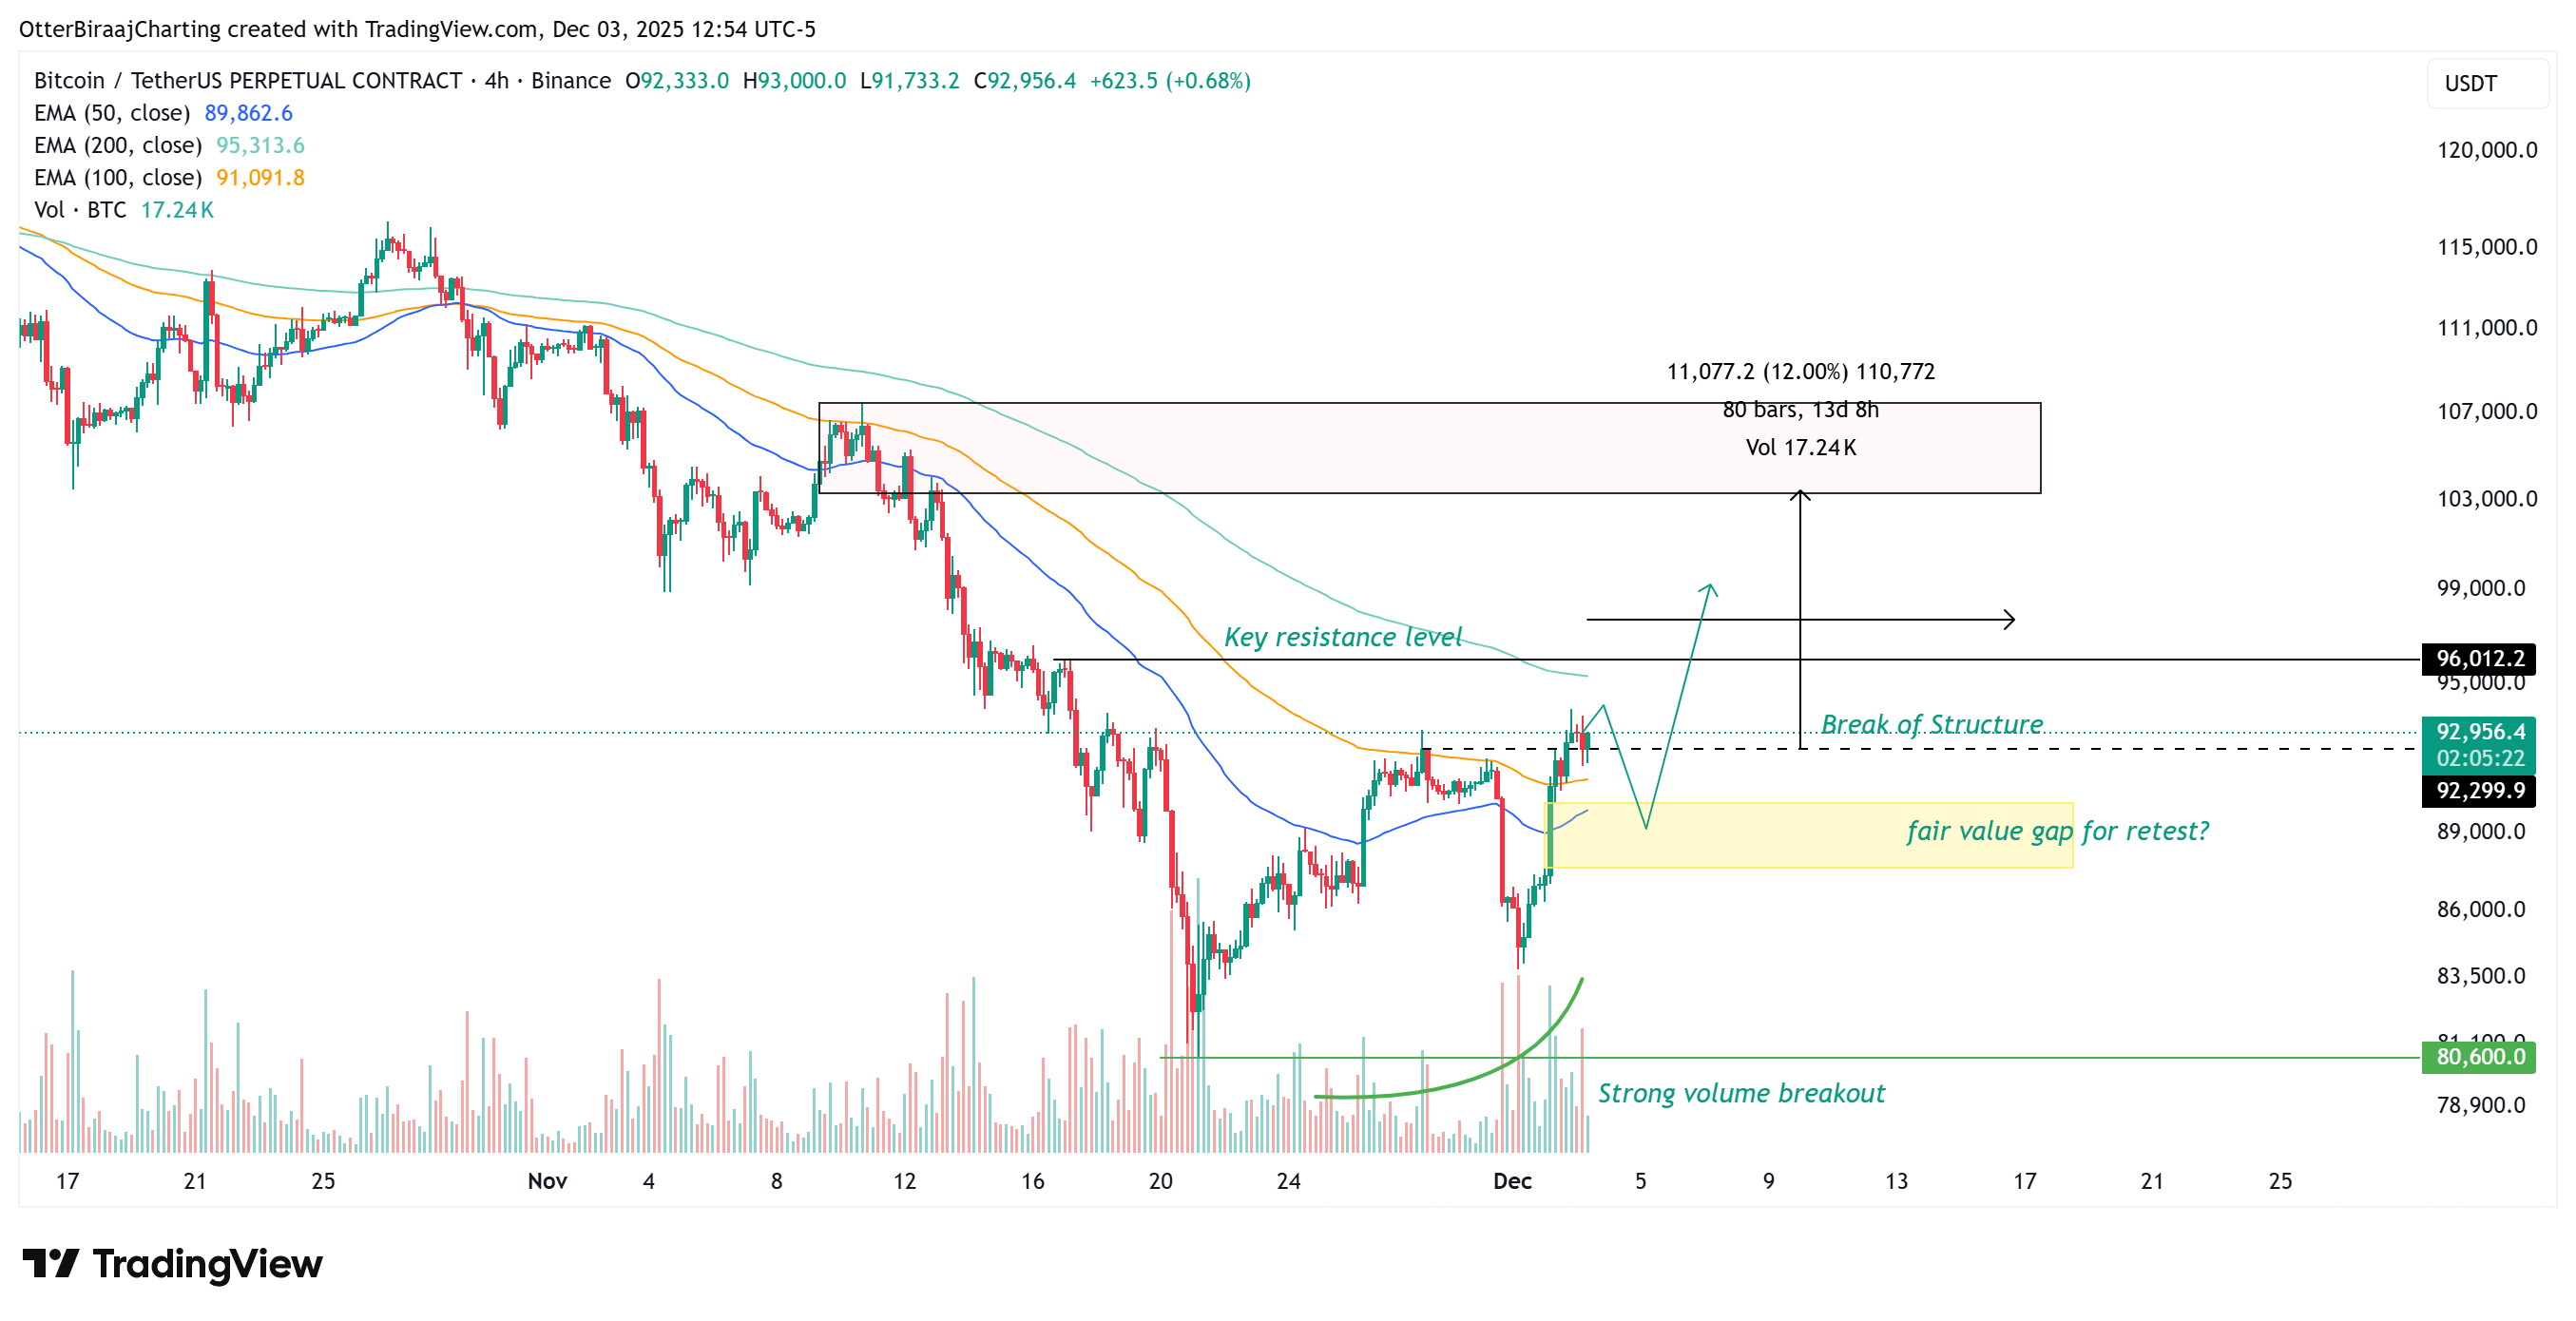 Bitcoin four-hour chart. Source: Cointelegraph/TradingView
A bullish break of structure (BOS) above $92,300 is now forming. A confirmed BOS would shift the short-term trend decisively upward, even if BTC momentarily revisits the fair value gap (FVG) between $90,000 and $88,000 while continuing to grind higher.
The daily chart still lacks full conviction until Bitcoin closes above $96,000. This level is critical because it represents a BOS on the higher time frame. Clearing it would confirm a complete shift in trend structure, not just a relief bounce.
Once $96,000 is reclaimed on a daily closing basis, BTC’s immediate target zone expands toward $102,000–$107,000, where a large cluster of external liquidity remains. This range encompasses previous swing highs, unmitigated stop-loss pockets, and liquidity from breakout traders waiting above prior resistance levels.
In market structure terms, these areas can act like magnets; once a decisive breakout clears the final barrier, in this case, the $96,000 level.
Related: Bitcoin adds $732B in new capital this cycle as market structure transforms
Aggressive buy-side flow and improving premium support the recovery
Data from CryptoQuant indicated that the market buy-to-sell ratio spiked to 1.17, the strongest reading since the cycle began in January 2023. Such aggressive buy-side dominance typically appears early in expansion phases when structural flows accelerate.
 Bitcoin Taker Buy Sell ratio. Source: CryptoQuant
Meanwhile, the Coinbase Premium Index shifted to a positive value of +0.03 after weeks of US selling pressure. Positive premium readings historically signal renewed institutional investor demand. Binance spot and perpetual volumes are also rising in parallel, and the price gap between Binance and Coinbase has tightened, reflecting healthier global liquidity.
Related: Bitcoin Bollinger Bands repeat ‘parabolic’ bull signal from late 2023
![[Bitpush Daily News Selection] Trump actively hints at Hassett as the next Federal Reserve Chairman; Bloomberg: Strategy may consider offering bitcoin lending services in the future; Strategy CEO: Strategy sets $1.4 billion reserve through stock sale to ease bitcoin selling pressure; Sony may launch a US dollar stablecoin for payments in gaming, anime, and other ecosystems](https://img.bgstatic.com/multiLang/image/social/44682a8c7537c9a9b467e17ed74a704d1764777241317.jpg)