Crypto Market Prediction: 150% Shiba Inu (SHIB) Skyrocketing, Is Ethereum (ETH) Death Cross Cancelation Confirmed? Where's Bitcoin (BTC) Going to Sto

Despite the questionable performance on the market of all three assets in our review, there is a great possibility of a recovery continuation. The main culprit here is local resistance, which can be broken if at least a fraction of yesterday's buying volume reappears on the market.
Shiba Inu's agressive bullishness
On the surface, this looks like the kind of ignition event traders wait for in downtrending markets. Shiba Inu just printed one of its most aggressive single-day volume surges in months, roughly a 150% spike. The problem is that SHIB remains structurally pinned below every significant moving average (50, 100, 200) on the chart.
Relatively speaking, yesterday’s volume was explosive, but today’s weaker follow-through turns that signal into something far more ambiguous. Was it a classic exit pump in a weary market, or was it genuine accumulation? Based on the price action, the second interpretation is less convincing.
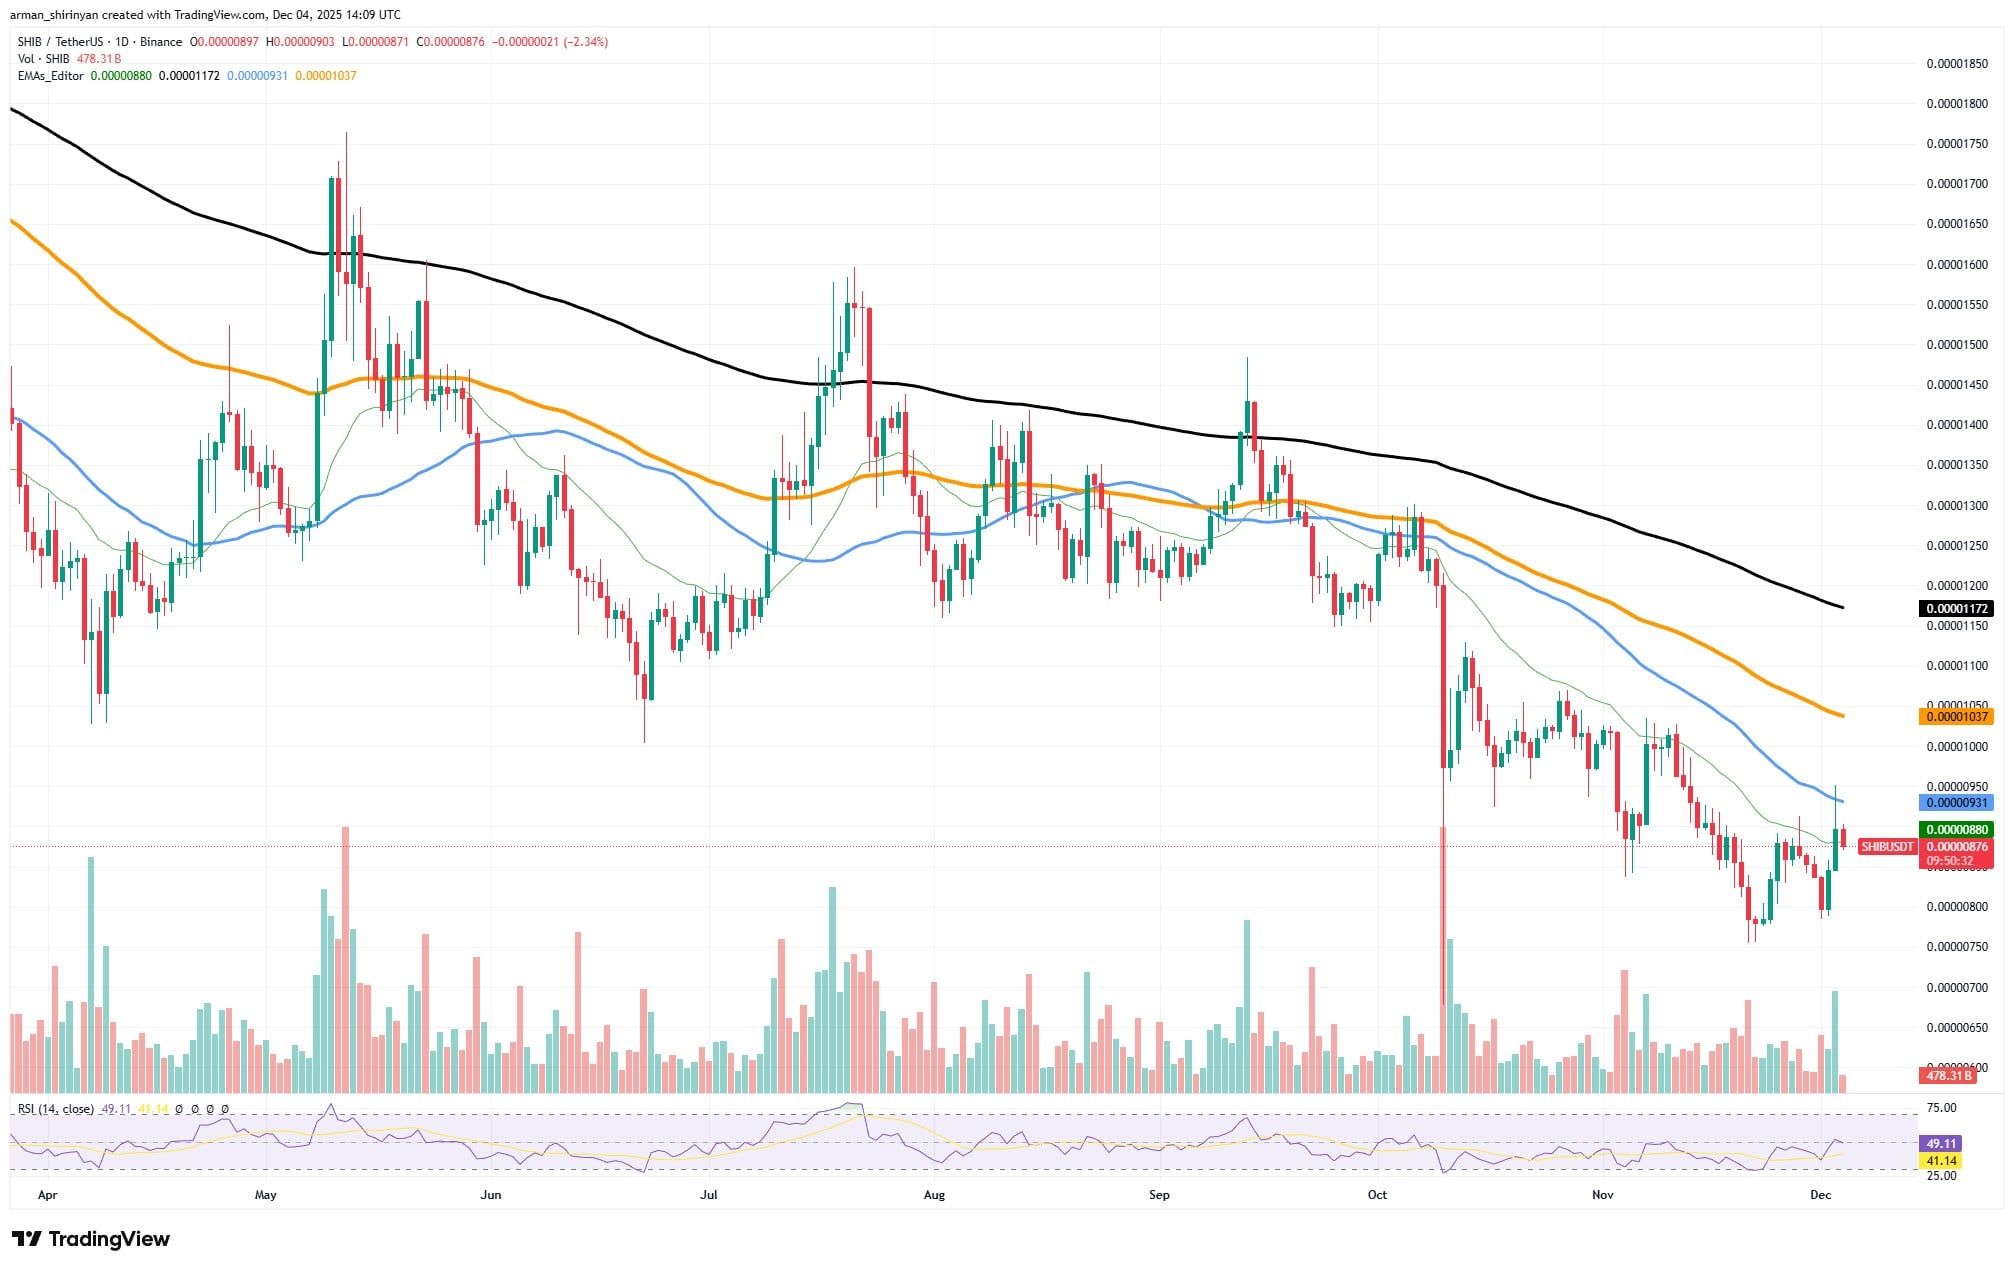
SHIB’s bounce was rejected almost immediately, leaving a long upper wick after stalling at the 50-day EMA — a level it has not touched since early October. That is not what strong reversals look like. When a real trend shift occurs, shorts are typically forced to cover, producing a decisive close above resistance. Instead, the momentum evaporated, and buyers retreated as quickly as they appeared.
The skepticism deepens when looking at RSI levels hovering in the low-40s. SHIB is not strong enough to show bullish momentum, nor is it oversold enough to suggest a classic reversal setup. It is stuck in a middle zone, where conviction usually fades rather than strengthens.
The chance of recovery is not zero, though. A second high-volume day would signal that yesterday was not just noise — but this time the candle would need to close green and reclaim at least the $0.00000930-$0.00001000 range. Break that range, and a relief rally toward the 100-day EMA becomes possible. Fail, and the market will likely interpret the 150% volume spike as distribution by more astute traders taking advantage of fleeting sentiment.
Ethereum's grim signal was not that scary
Ethereum is progressing to a point where the much-discussed death cross may end up being irrelevant. For weeks, the 50-day moving average has been closing in on the 200-day, and the pair recently completed a bearish cross — typically a strong signal that further downside is coming. Yet price action has refused to follow the script.
Death-cross fakeouts usually begin this way: momentum shifts before the averages react, leaving bears positioned for a continuation that never materializes. Because the crowd tends to overreact to the cross, ETH has historically printed some of its stronger rallies in these conditions — not because the death cross has mystical predictive power but because positioning becomes lopsided.
The death cross and golden cross simply do not command the same forecasting reliability in today’s market, where algorithmic strategies compress volatility and liquidity remains thin across majors. Still, they influence sentiment, position flows and liquidation cascades, and that alone can amplify price swings.
ETH is currently testing the underside of the 50-day EMA, with RSI already back in the mid-50s and volume ticking higher. That setup signals that buyers are willing to reengage early. If ETH pushes into and holds the $3,350-$3,500 zone, the 50-day average will begin to curl upward, effectively negating the death cross. From there, bears face forced covering, short liquidations and momentum traders flipping long.
Bitcoin pushes back
Bitcoin’s latest surge pushed the price back toward the $93,000 range, but the chart suggests this is less a clean recovery and more a potential inflection point. The sharp bounce off $86,000 was driven by short covering and oversold conditions, yet the broader structure has not changed. Bitcoin is still trading below the 50-, 100- and 200-day moving averages, all of which continue to slope downward. That is not the posture of a market preparing for a trend reversal; it is a market under sustained macro pressure.
The first meaningful test sits in the $93,000 area. BTC is running directly into the underside of the declining 20-day EMA, a zone that often becomes dynamic resistance once momentum breaks. The rally starts to lose credibility if Bitcoin fails to secure a daily close above this band, which would shove the market back into the lower range.
That lower boundary is the already-swept $86,000 level. A second visit is not far-fetched. If buyers fail to defend it again, the structure deteriorates further and the low-$80,000s become the next logical magnet. The issue is not just price levels; the broader trend is still deteriorating, and months of distribution have created heavy overhead supply that caps upside attempts.
Sentiment could pivot quickly if Bitcoin manages to hold $93,000 and extend into the $95,000-$97,000 range. Reclaiming that zone, which sits just below the 50-day moving average, would force short sellers to unwind and trigger fresh positioning shifts. But bulls still carry the burden of proof. Nothing on the chart confirms sustained strength: the moving averages remain stacked against continuation, volume is inconsistent and the RSI is improving but nowhere near breaking its broader downtrend.
So where is Bitcoin likely to land?
-
The ceiling is roughly $93,000 unless buyers show real conviction.
-
$86,000 remains the weakest point in the structure.
-
Lose $86,000 again, and lower levels become the high-probability outcome.
Disclaimer: The content of this article solely reflects the author's opinion and does not represent the platform in any capacity. This article is not intended to serve as a reference for making investment decisions.
You may also like
ZEC Value Rises 5.73% as Short Sellers Adjust Positions During Market Fluctuations
- ZEC surged 5.73% in 24 hours to $385.59, defying 9.19% weekly/monthly declines but rising 590.63% annually amid market turbulence. - "Calm Long King" trader increased ZEC short positions to $2.51M (10x leverage) with a $20K unrealized gain, contrasting losses in BTC and SOL shorts. - The trader's $17.29M ZEC short exposure reflects volatile market dynamics, with leveraged positions showing mixed gains/losses as crypto prices swing sharply. - ZEC's 24-hour rebound highlights risks for short sellers in a m

ZEC Rises 4.77% Amid Increased Short Positions and Market Rebound
- ZEC surged 4.77% in 24 hours to $386.31, with a 584.4% annual gain despite recent declines. - A prominent trader increased ZEC short positions to $17.29M, showing a $20k gain but larger losses in BTC and SOL. - Market recovery and short-position adjustments highlight ZEC’s volatility, with analysts warning of potential downward pressure if prices rise further.

ALGO Falls 1.01% While Investors Anticipate Crucial U.S. Inflation Report
- Algorand (ALGO) fell 1.01% in 24 hours to $0.1372, but rose 0.44% weekly/monthly amid market uncertainty. - Investors focus on U.S. inflation data and Fed policy, with Chair Powell signaling cautious rate-cut approach for 2026. - Earnings reports from Airbnb , Coca-Cola , and Coinbase will shape sector sentiment, while unrelated lawsuits impact PRGO and ALVO. - Global volatility in travel/aviation sectors and India's IndiGo disruptions highlight broader market risks unrelated to crypto.

BCH has increased by 32.06% over the past year as the market remains steady
- Bitcoin Cash (BCH) fell 0.19% in 24 hours but rose 32.06% annually, reflecting strong long-term demand and institutional interest. - Analysts highlight BCH's resilience amid stable trading ranges, driven by cross-border transactions and micropayments adoption. - Sustained 6.1% gains over 30 days and 7-day periods underscore BCH's role as a high-utility altcoin in diversified portfolios. - Market stability and growing mainstream recognition position BCH for continued performance amid broader crypto sustai