Ethereum’s Ether ( ETH ) token may rally by over 80% versus Bitcoin ( BTC ) in 2026, according to a classic bullish reversal scenario developing on its long-term charts.
Key points:
ETH/BTC charts point to a potential move toward 0.059–0.063 BTC in 2026.
Rejection at the long-term trendline could send the pair back toward 0.0175 BTC.
Ether price chart hints at 80% rally versus Bitcoin
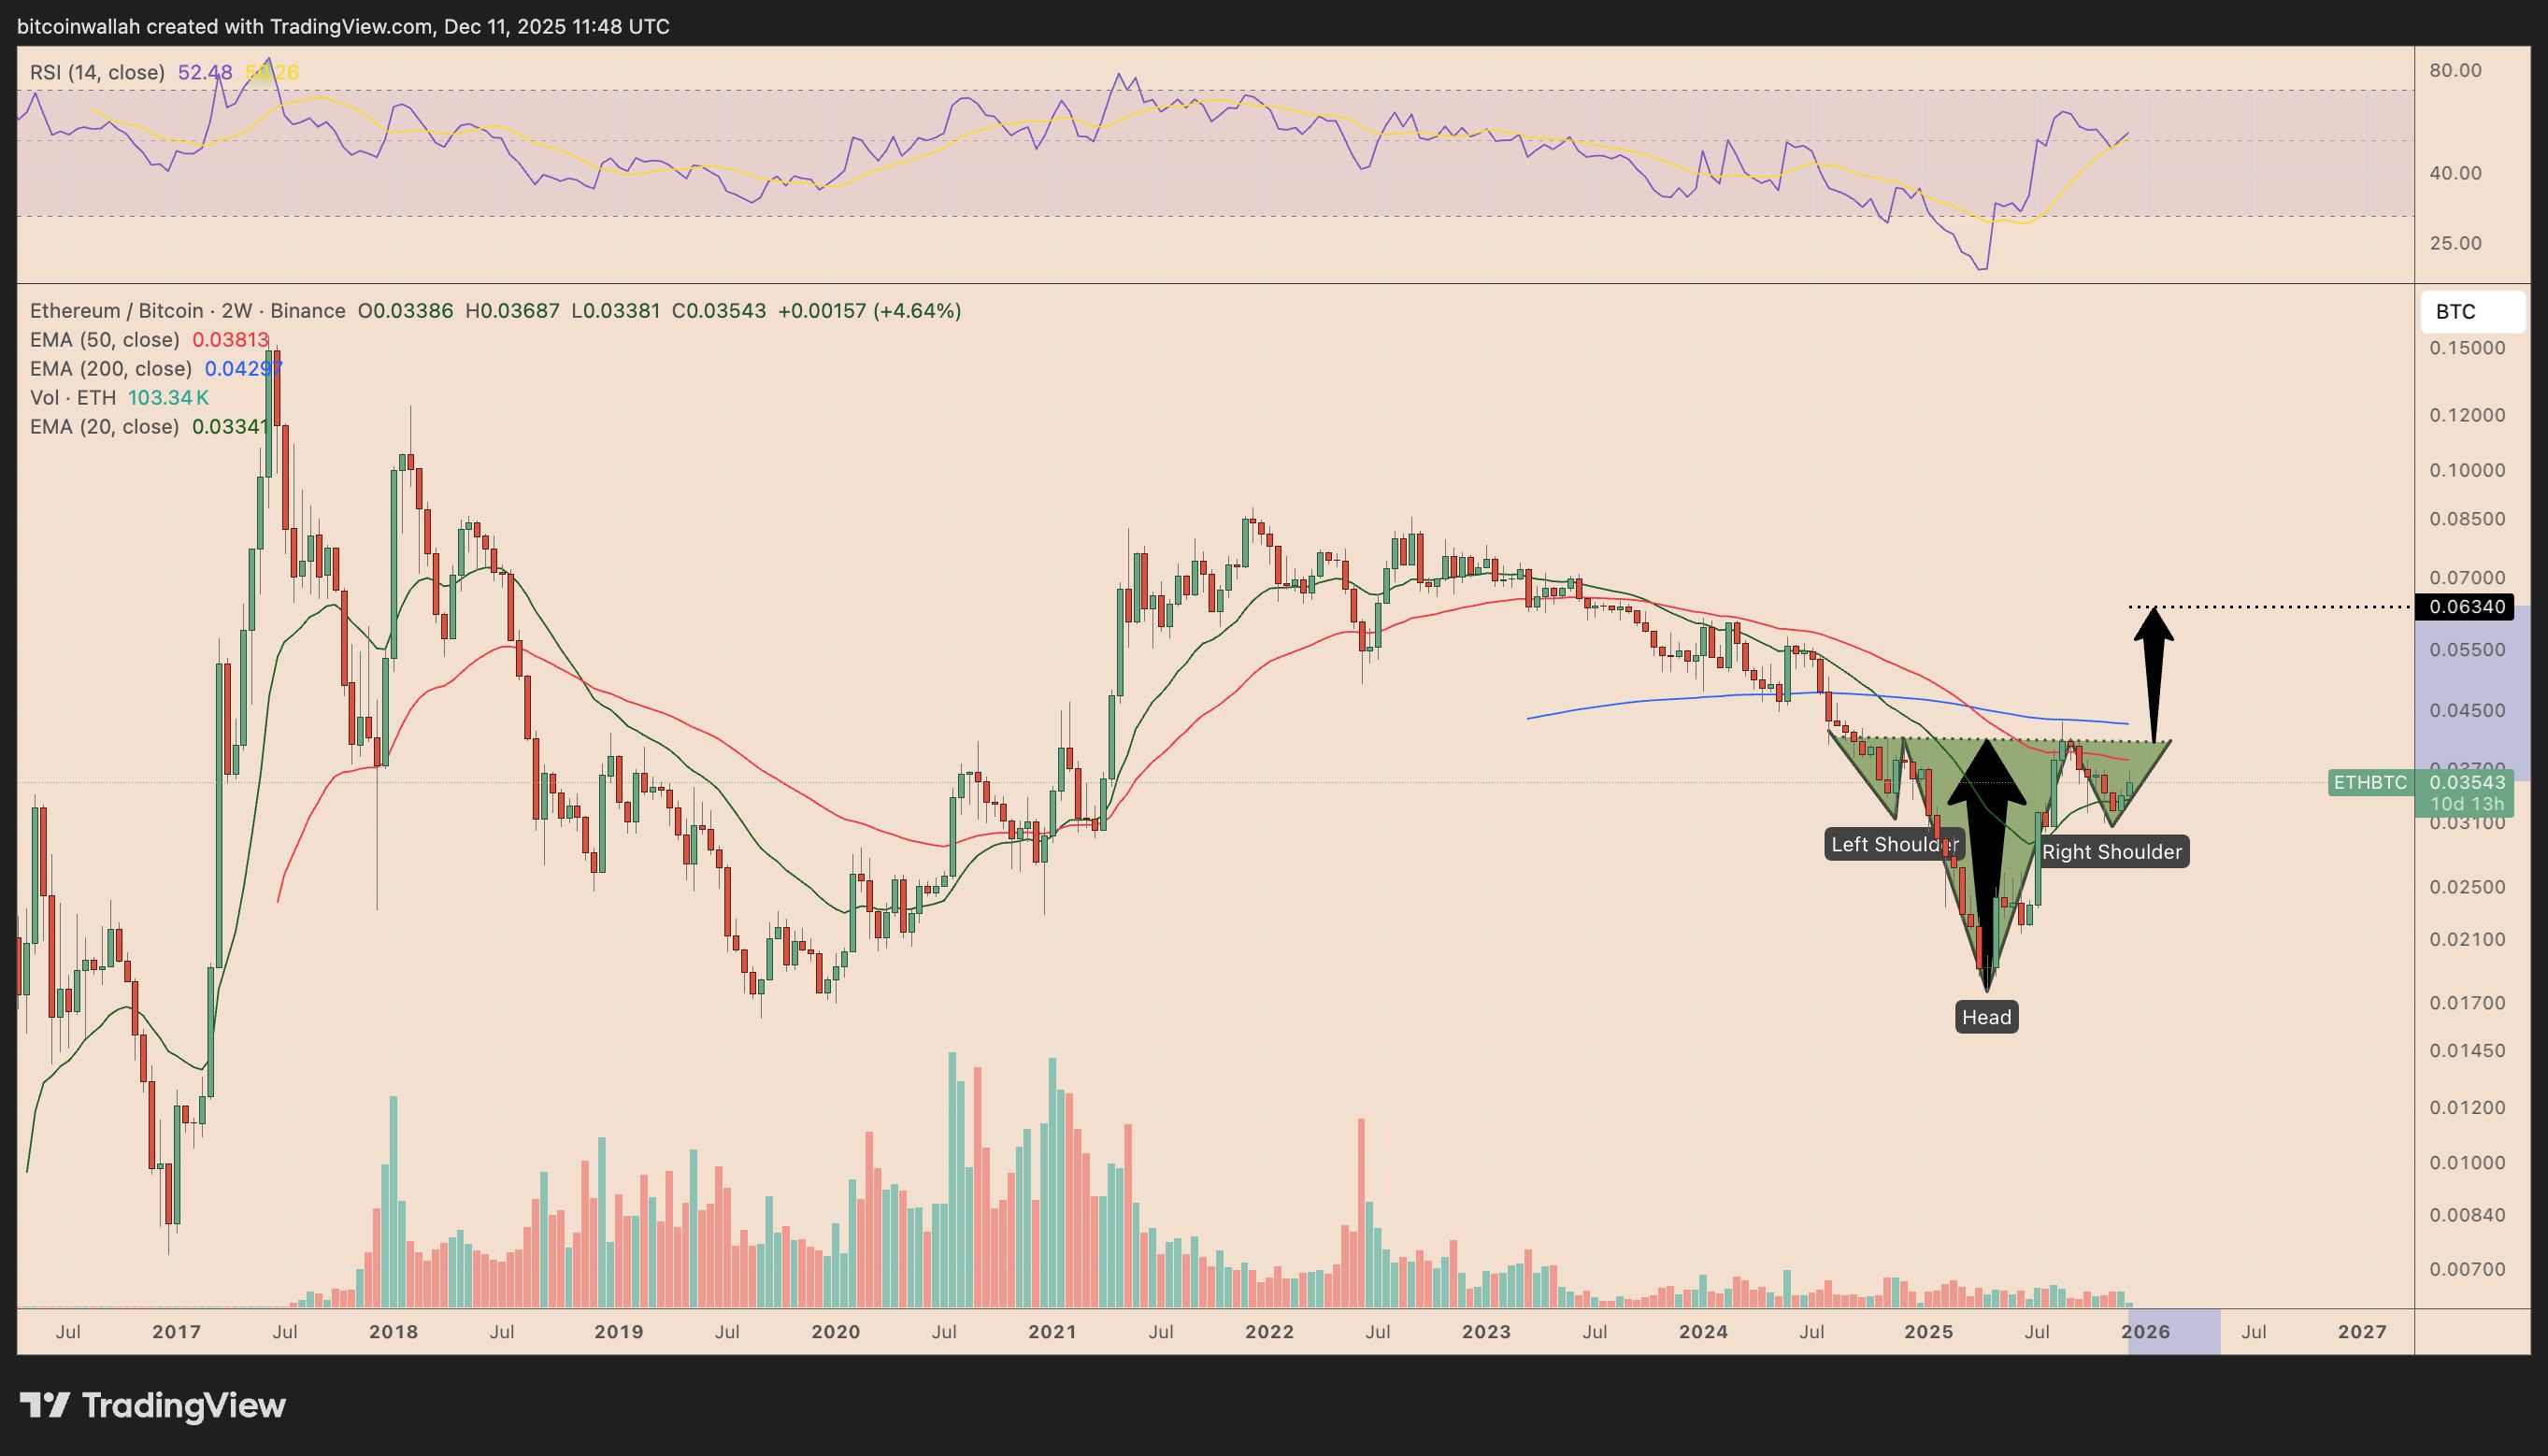
As of December, ETH/BTC’s two-week chart displayed a textbook inverse head-and-shoulders (IH&S) formation, a classic bullish reversal pattern that typically follows prolonged downtrends.
 ETH/BTC two-week chart. Source: TradingView
The pattern’s left shoulder formed during late-2024 weakness, followed by an aggressive capitulation in April 2025 that carved out the head around 0.0176 BTC. This subsequent recovery established a higher low in Q4 2025, forming the right shoulder.
The neckline was around 0.0400 BTC, situated between the 50-period (red) and 200-period (blue) exponential moving averages (EMAs).
Related: Ethereum rising to $3.3K proves bottom is in: Is 100% ETH rally next?
A decisive breakout above this zone will likely confirm the IH&S pattern, paving the way for a measured move toward 0.063 BTC in 2026.
This upside target was up 80% from the ETH/BTC rates recorded as of Thursday.
Can ETH copy its 450% parabolic move from 2020?
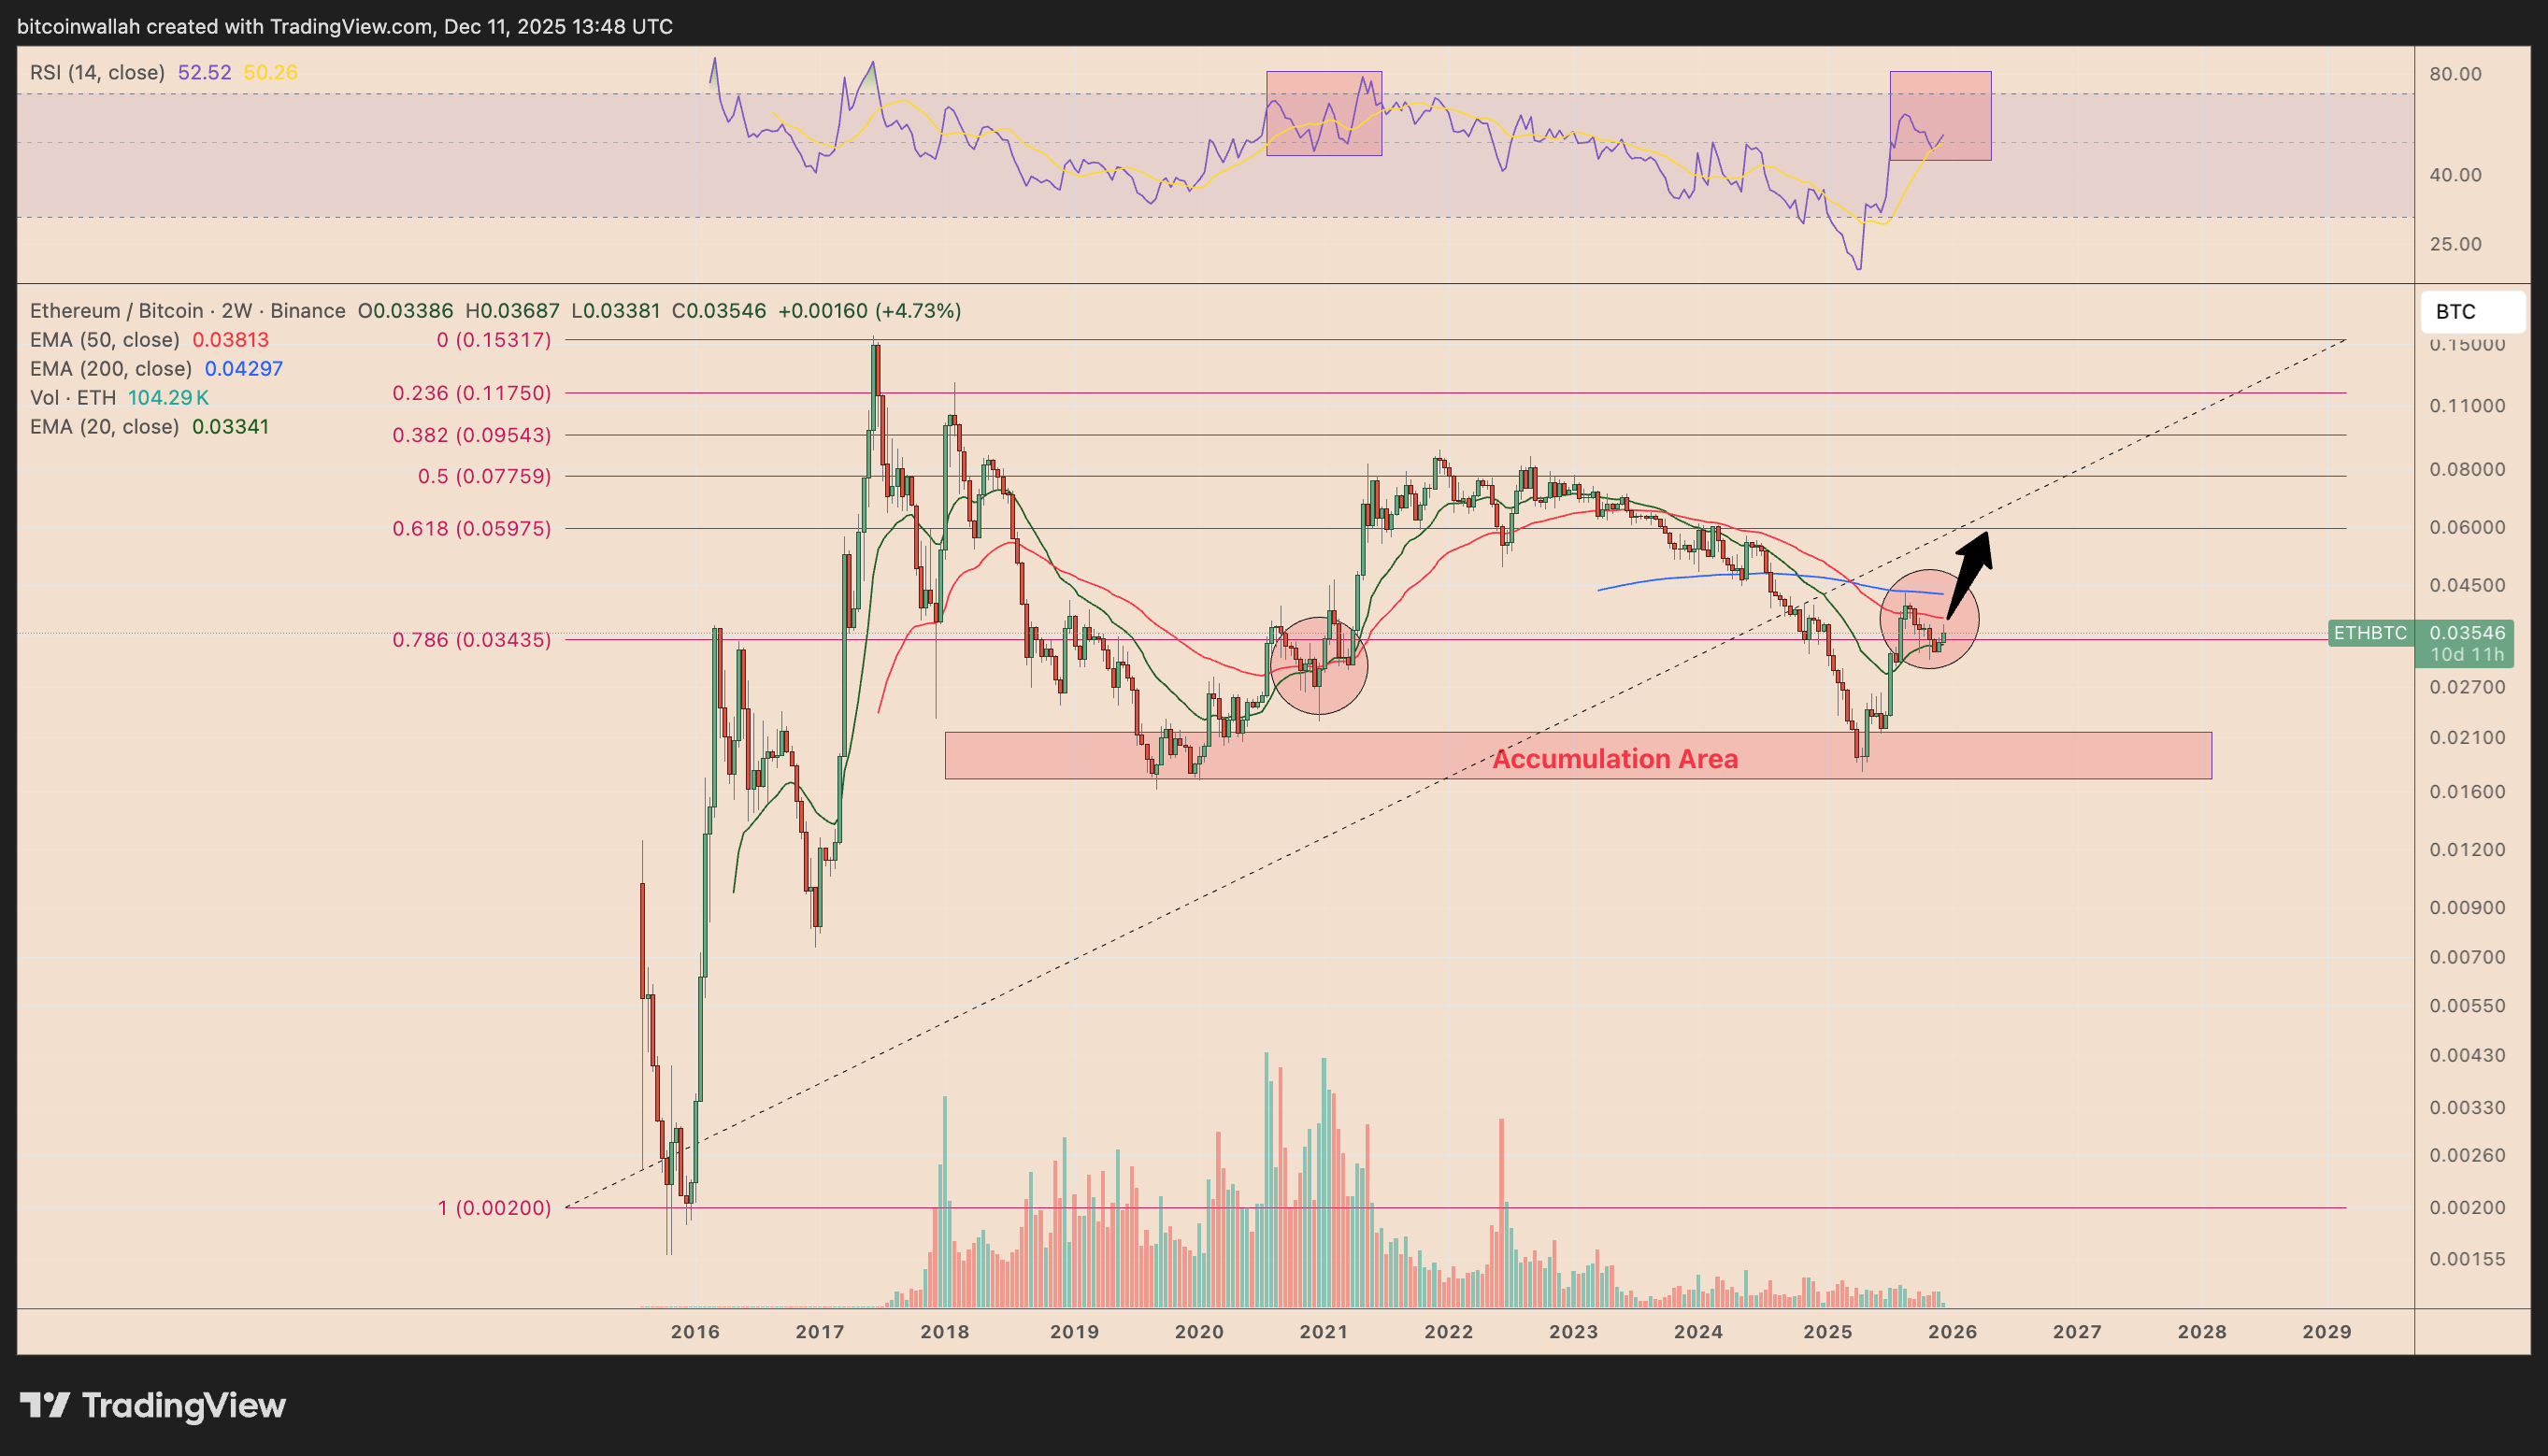
ETH/BTC’s current rebound closely mirrored the breakout that followed its 2019-2020 accumulation phase.
The pair rallied nearly 450% after bottoming within the same 0.0160–0.0200 BTC demand zone.
 ETH/BTC two-week chart. Source: TradingView
Ether’s 2025 recovery originated from this identical structural floor, and price is now pressing into the same early-stage resistance cluster (represented via red circles in the chart above) that preceded the 2020 parabolic expansion.
ETH/BTC could climb toward the 0.059 BTC Fibonacci zone, a level consistent with the IH&S breakout trajectory heading into 2026, if this fractal continues to play out.
Ethereum is still in a downtrend vs. Bitcoin
However, the ETH bulls will have to prove that the long-term downtrend is actually over.
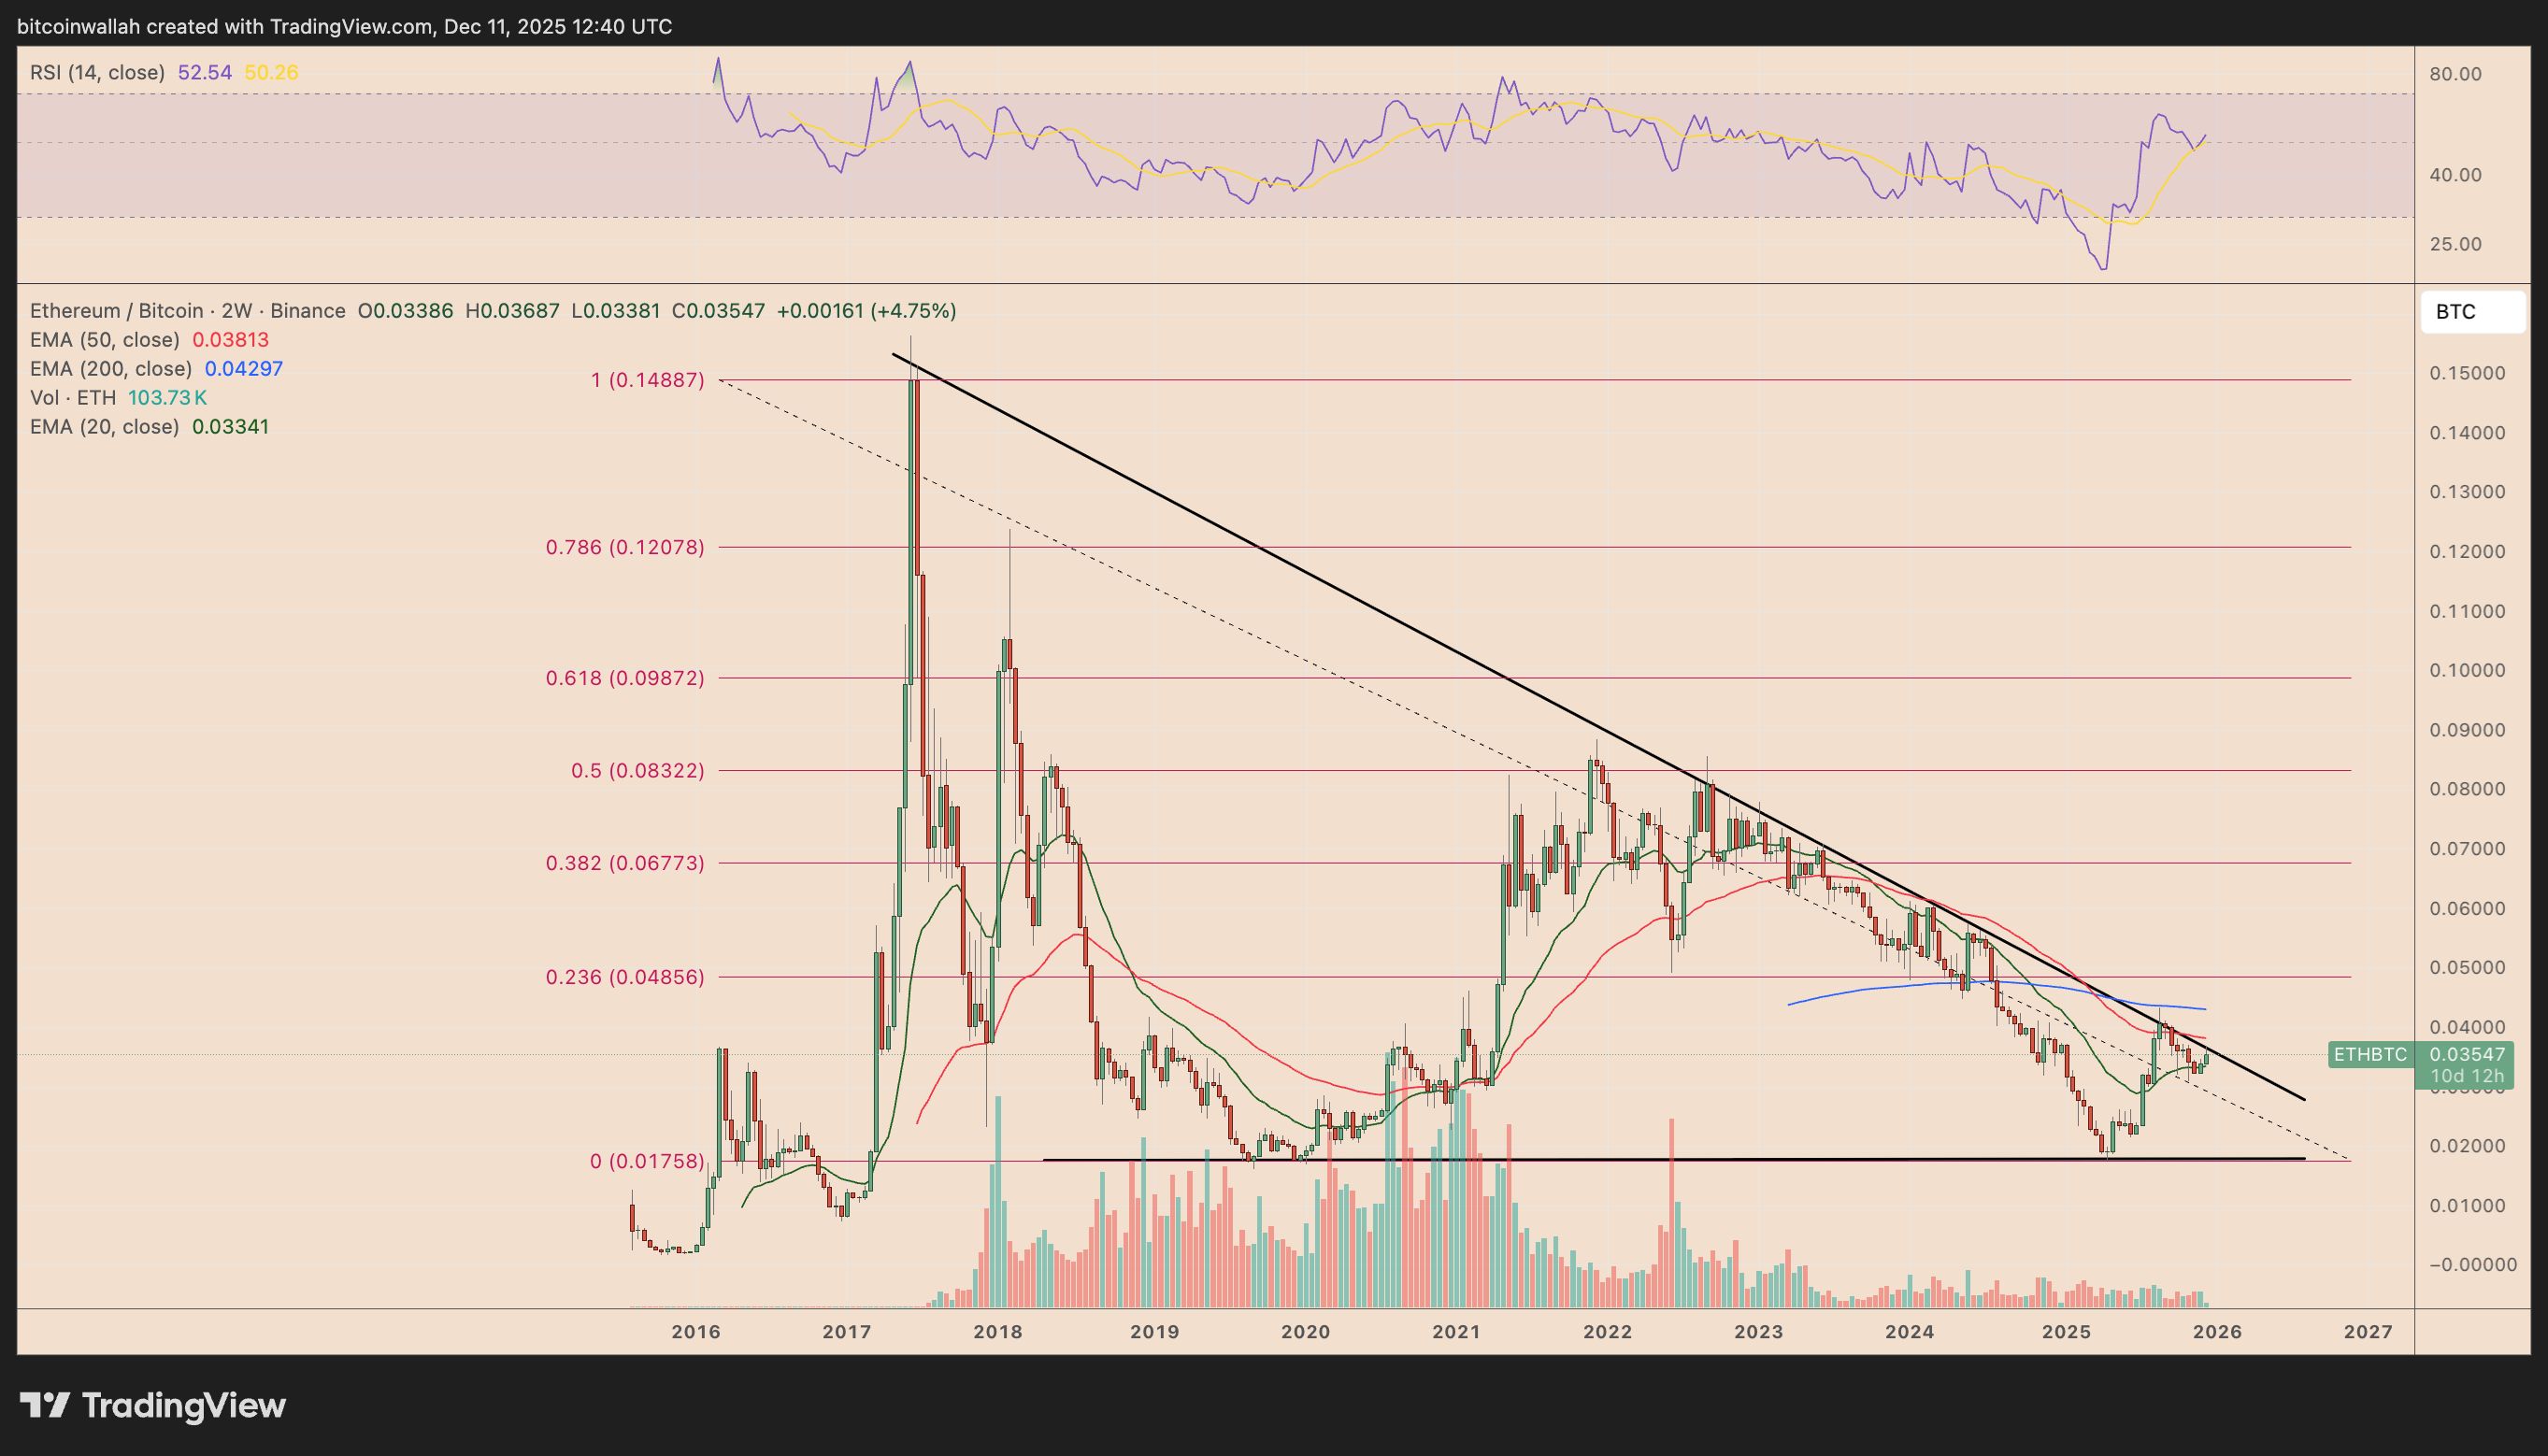
Ether remains capped by a multiyear descending trendline that has rejected every breakout attempt against Bitcoin since 2017.
 ETH/BTC two-week chart. Source: TradingView
A fresh failure at this barrier would undermine the IH&S and fractal setups and raise the risk of a pullback toward the long-standing 0.0175 BTC support in 2026.