Date: Thu, Dec 11, 2025 | 07:00 PM GMT
The broader cryptocurrency market is undergoing notable retracement after the pre-FOMC pump, with Bitcoin (BTC) and Ethereum (ETH) falling over 2% and 5% today. This renewed weakness has added downward pressure on major altcoins, including Render (RENDER), which has seen a fresh 5% decline.
But beneath the surface-level weakness, the chart is revealing a potential bullish setup that may soon come into play.
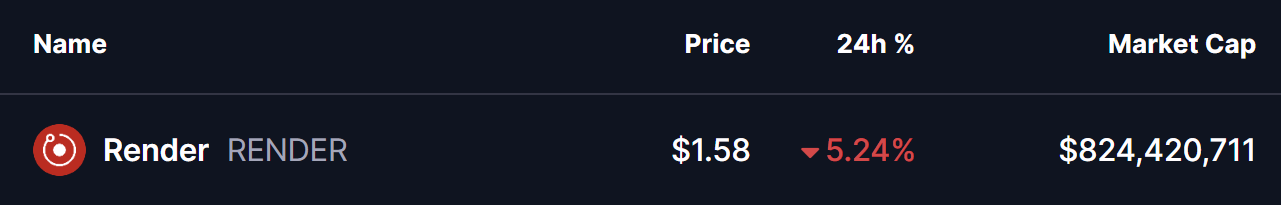 Source: Coinmarketcap
Triple Bottom in Play
On the 4H timeframe, RENDER has developed a clear Triple Bottom structure — a well-known reversal pattern defined by three consecutive swing lows reacting from the same support level. In this case, the repeated rejection of the $1.54 support shows that buyers are absorbing the dips and preventing deeper breakdowns.
Inside the highlighted consolidation range, price continues to move between the lower boundary at $1.54 and the upper neckline zone near $1.78. This range has been respected for nearly two weeks, with each touch of the bottom boundary producing a reactionary bounce. The current retest once again brings RENDER into this same demand zone, which in previous cycles triggered strong upward pushes.
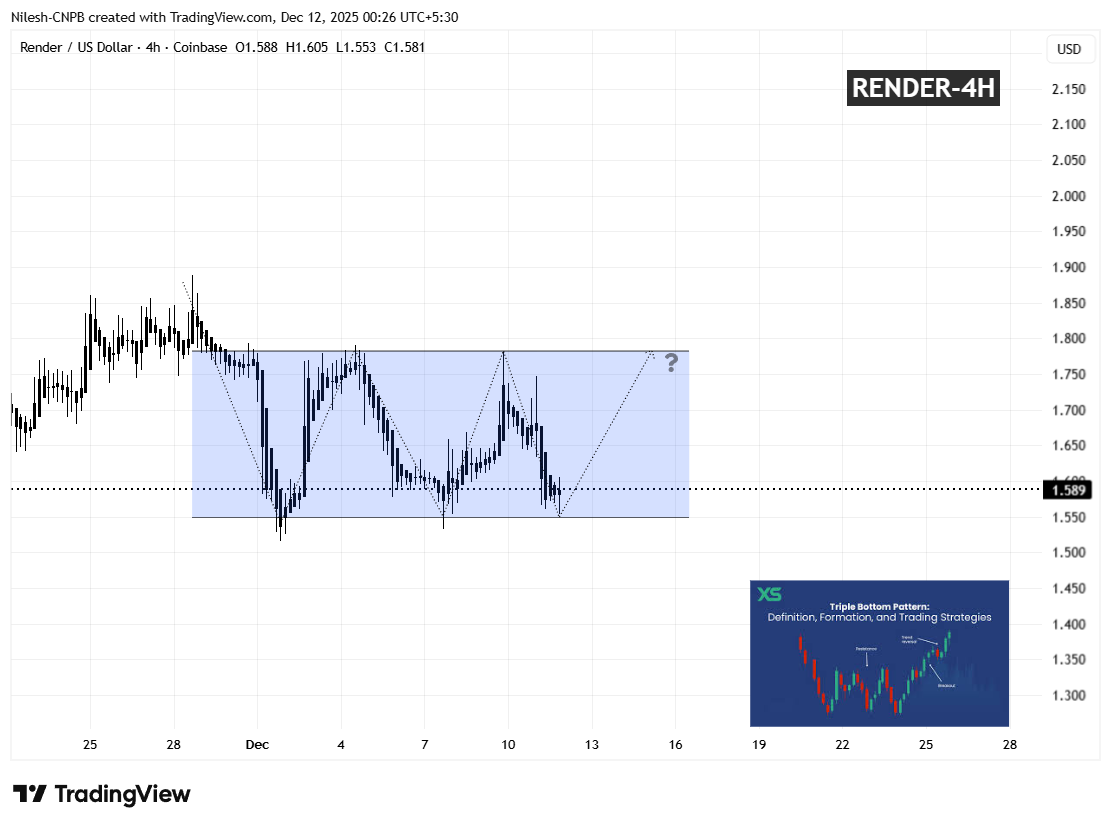 Render (RENDER) 4H Chart/Coinsprobe (Source: Tradingview)
This consistent defense of support leans more toward accumulation than continuation — suggesting sellers may be losing strength while buyers quietly build positions.
What’s Next for RENDER?
If RENDER can hold above the $1.50–$1.54 support region and avoid any candle close below the level, the third swing low would complete the Triple Bottom structure. Such a confirmation could open a move toward the neckline zone at $1.78, roughly 12% above the current price.
A clean breakout above $1.78, ideally supported by volume expansion, would validate the reversal and pave the way for continuation toward the $2.00 region — the next major upside magnet on the chart.
However, a breakdown and close below $1.50 would invalidate the bullish setup and shift focus back toward lower supports.