Date: Sat, Dec 13, 2025 | 04:10 AM GMT
The broader cryptocurrency market has been experiencing choppy price action over the past several weeks, a phase that began after the sharp sell-off on October 10 . That correction dragged Bitcoin (BTC) from sub-$120,000 levels down toward the current $90,000 zone. Over the last 30 days alone, BTC has declined by nearly 11%, keeping market sentiment cautious.
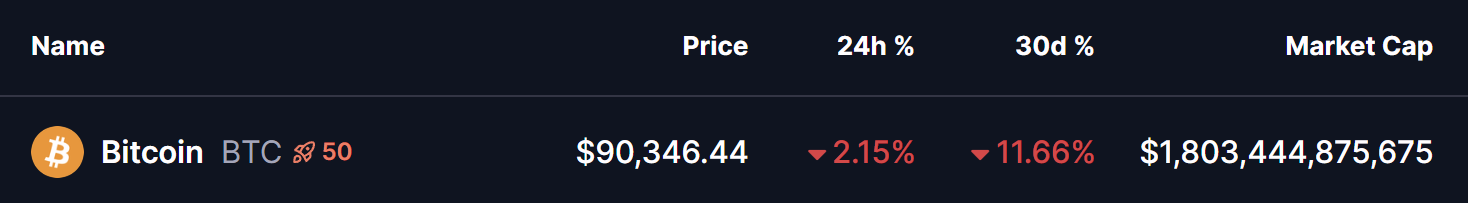 Source: Coinmarketcap
However, while price weakness dominates headlines, the technical chart is beginning to tell a more nuanced story — one that may favor a rebound scenario if buyers continue to defend a critical support area.
Ascending Triangle Pattern in Play?
Despite growing bearish commentary around patterns such as bear flags and rising wedges, the 4-hour BTC chart is also carving out a structure that leans bullish. Price action is forming an ascending triangle, a pattern typically associated with continuation moves once resistance is cleared.
This structure is defined by a rising trendline that has consistently supported higher lows, while BTC repeatedly tests horizontal resistance near the $94,500 region. This morning’s dip pushed BTC down toward $89,504, precisely where the rising trendline comes into play. The market responded with buying interest, suggesting that bulls are still actively defending this zone.
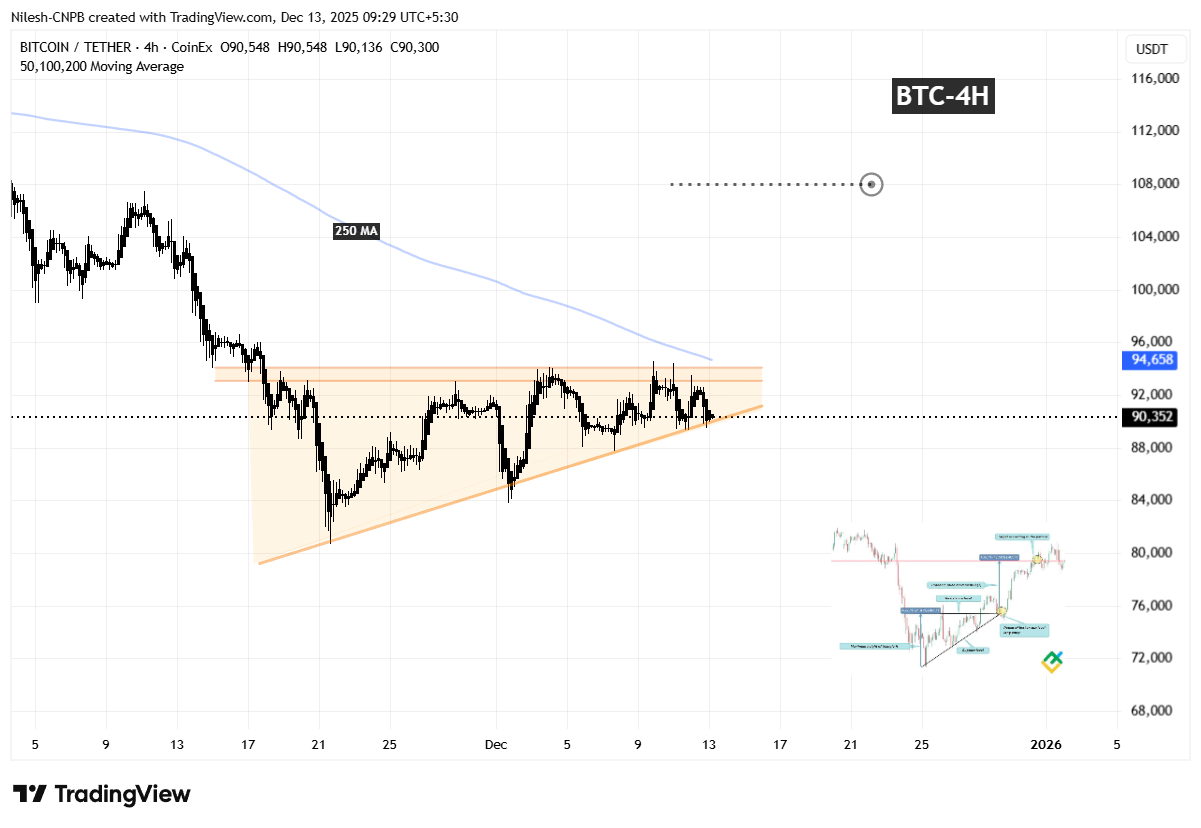 Bitcoin (BTC) 4H Chart/Coinsprobe (Source: Tradingview)
As long as BTC continues to respect this ascending support, the integrity of the pattern remains intact, keeping the door open for a recovery attempt.
What the Chart Signals Next
The $89,000–$90,000 region now stands as the most important level to watch. Holding above this zone increases the probability of another push toward $94,500, which remains the primary resistance area. Adding to its importance, the 250-period moving average sits just above at around $94,579, strengthening this barrier.
A decisive breakout above both the horizontal resistance and the 250 MA would confirm the ascending triangle breakout. Such a move could shift momentum firmly back in favor of the bulls.
Based on the measured move projection of the triangle, a confirmed breakout points toward a potential upside target near $108,000, aligning with the dotted extension zone marked on the chart. This represents roughly a 19% upside from current price levels.
For now, BTC remains at a pivotal moment. As long as the rising trendline continues to hold and higher lows remain intact, the broader technical setup favors a bounce rather than a deeper breakdown.