
GBP/USD Price Forecast: Falls toward 1.3400 near 50-day EMA

GBP/USD extends its losses for the second successive session, trading around 1.3420 during the Asian hours on Monday. The technical analysis of the daily chart indicates that the 14-day Relative Strength Index (RSI) at 53 (neutral) has eased from near overbought, indicating that momentum has cooled while remaining above the midline. RSI holds above 50, keeping a modest bullish bias.
The nine-day Exponential Moving Average (EMA) stands above the 50-day EMA, preserving a bullish bias as price consolidates below the short-term average but holds over the medium-term line. This suggests a shallow pullback within the prevailing uptrend. The short-term trend pauses as the nine-day EMA flattens, while the rising 50-day EMA underpins the broader advance.
The immediate barrier lies at the nine-day EMA of 1.3455. A daily close back above the short-term average would reassert upside control and lead the GBP/USD pair to test the three-month high of 1.3534, reached on December 24. Further gains could open a move toward the six-month high of 1.3726, followed by the 1.3788, the highest level since October 2021.
On the downside, the GBP/USD pair falls toward the psychological level of 1.3400, followed by the 50-day EMA at 1.3363. A break below the medium-term price momentum and put downward pressure on the pair to navigate the region around the eight-month low of 1.3010.
(The technical analysis of this story was written with the help of an AI tool.)
Disclaimer: The content of this article solely reflects the author's opinion and does not represent the platform in any capacity. This article is not intended to serve as a reference for making investment decisions.
You may also like
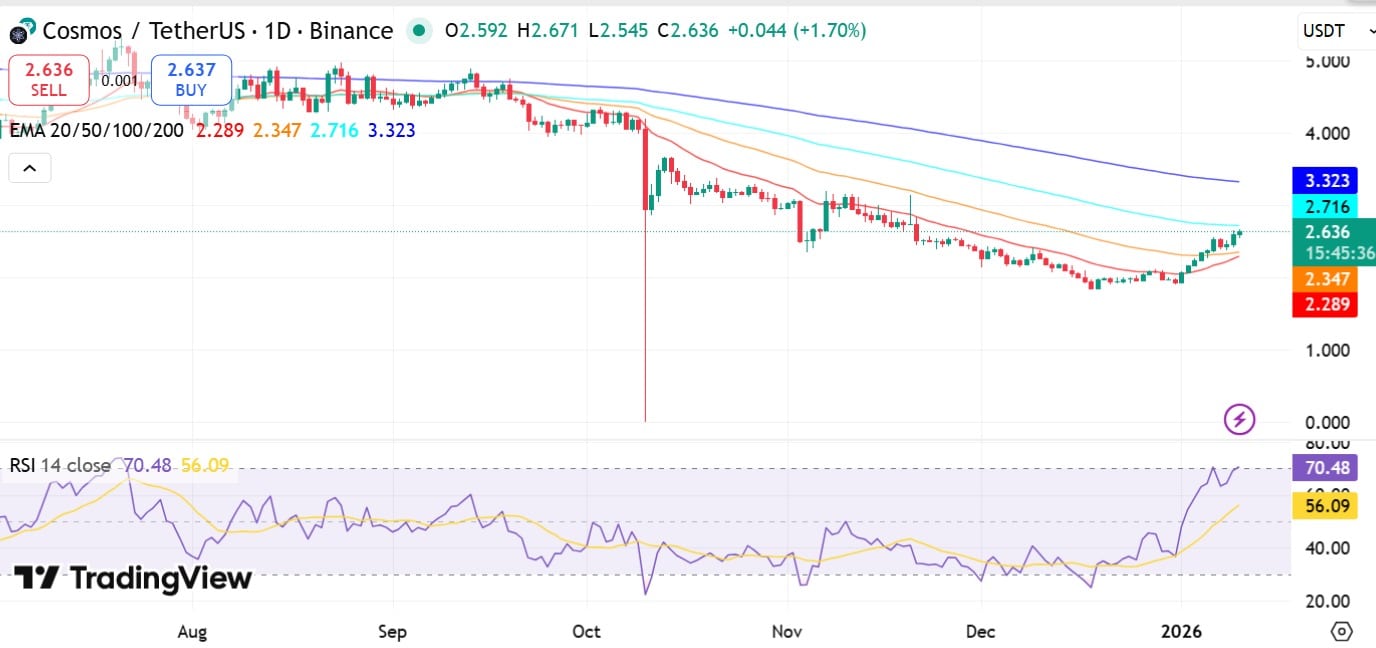
After ATOM’s 2-month high, is $3.3 next for the altcoin’s price?
Unstable Global Climate Signals New Phase for Defense Stock Surge
Bitcoin (BTC) Holds Strong Amid Institutional Buying Signals Renewed Market Confidence

Walmart Set to Enter Nasdaq 100 on January 20, Replacing AstraZeneca