thecryptobasic.com
A well-known market analyst recently called the XRP 1-week chart “one of the best-looking charts out there,” presenting a target for his green box setup.
This commentary came from the anonymous analyst behind the “Freedom by 40” account, which targets financial freedom for investors by at most 40 years. Notably, the analyst has persistently called the XRP weekly chart the best chart in the market, but he recently reiterated the sentiment amid the ongoing XRP rebound.
XRP Has One of the Best-Looking Charts
For context, after an abysmal Q4 2025, which led to a 35% collapse from $2.84 in October 2025 to $1.839 by the end of the year, XRP began the new year, 2026, with a strong recovery effort alongside the rest of the crypto market. So far, XRP has spiked 30% this year, outperforming BTC (+7%), ETH (+8.5%), SOL (+11.6%), BNB (+4.83%), and most other assets among the top 20.
With this recovery, the “Freedom by 40” analyst took to X today to again call XRP one of the best-looking charts he has observed, building on a previous analysis from October 2025. His chart confirmed that XRP was following a broader five-wave Elliott Wave structure on the weekly timeframe, which began in early 2023.
The altcoin completed Wave 1 when it rose to $0.94 in July 2023 on the back of the favorable ruling in the SEC case, and then completed Wave 2 when it corrected from the $0.94 high to a low of $0.38 in July 2024. The third wave began shortly after, and ended with XRP reaching the $3.4 peak in January 2025 on the back of the Trump-led rally.
Meanwhile, the rebound that started after this peak marked the formation of the corrective fourth wave, aligning with a smaller ABC correction. At the time of his October 2025 analysis, XRP traded for $2.55. However, the analyst had projected that the C correction would push XRP to lower prices, completing Wave 4 before a recovery emerges.
XRP Begins Recovery Push, Eyes Green Box Target
Interestingly, XRP followed this path, collapsing to as low as $1.82 in December 2025. Now, XRP has begun recovering from the Q4 2025 downtrend, which aligns with the market analyst’s Wave 5. This alignment with his Elliott Wave structure prompted the latest suggestion that XRP remains one of the best-looking charts.
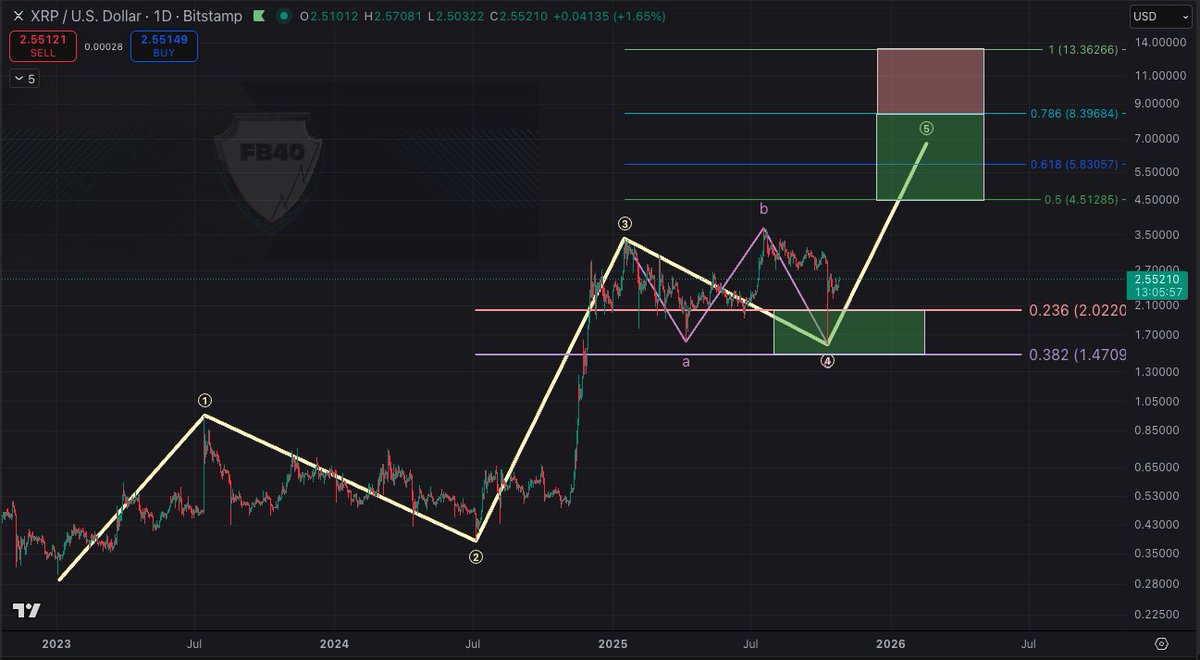
Data from his chart shows that the market analyst expects the ongoing Wave 5 to close within an area he marks with a green box. Specifically, this green box rests within a price range of $4.5 (Fibonacci 0.5) to $8.39 (Fibonacci 0.786). Notably, XRP has the potential to target any of these figures as it closes the Elliott Wave.
For perspective, XRP would need to increase by 89% to 252% to reach the price range within the green box. Nonetheless, the analyst believes an extended XRP rally to a higher pink box is still possible, though unlikely. For context, this pink box rests between $8.39 and $13.36 (Fibonacci 1).