
Industry Analysis: Assessing Microsoft's Position Relative to Other Software Companies

Comprehensive Analysis of Microsoft Versus Leading Software Industry Competitors
In today’s fast-paced and highly competitive business landscape, it is essential for investors and industry observers to conduct in-depth company evaluations. This article delivers a detailed comparison of Microsoft (NASDAQ: MSFT) and its primary rivals within the Software sector. By analyzing key financial indicators, market standing, and future growth potential, we aim to provide valuable perspectives for investors and highlight Microsoft’s position in the industry.
Overview of Microsoft
Microsoft is a global leader in both consumer and enterprise software solutions, widely recognized for its Windows operating systems and the Office productivity suite. The company operates through three main divisions: Productivity and Business Processes (including Office, Office 365, Exchange, SharePoint, Skype, LinkedIn, Dynamics), Intelligent Cloud (featuring Azure, Windows Server, SQL Server), and More Personal Computing (encompassing Windows Client, Xbox, Bing, display advertising, and Surface devices).
Financial Comparison: Microsoft and Its Peers
| Company | P/E | P/B | P/S | ROE | EBITDA (in billions) | Gross Profit (in billions) | Revenue Growth |
|---|---|---|---|---|---|---|---|
| Microsoft Corp | 33.63 | 9.68 | 12.01 | 7.85% | $48.06 | $53.63 | 18.43% |
| Oracle Corp | 36.20 | 18.47 | 9.13 | 22.68% | $9.51 | $10.68 | 14.22% |
| ServiceNow Inc | 89.24 | 13.78 | 12.20 | 4.52% | $0.89 | $2.63 | 21.81% |
| Palo Alto Networks Inc | 115.27 | 14.65 | 13.52 | 4.05% | $0.5 | $1.84 | 15.66% |
| Fortinet Inc | 32.07 | 78.85 | 9.17 | 33.9% | $0.64 | $1.39 | 14.38% |
| Gen Digital Inc | 28.73 | 6.56 | 3.65 | 5.56% | $0.5 | $0.95 | 25.26% |
| UiPath Inc | 38.17 | 4.45 | 5.64 | 11.08% | $0.02 | $0.34 | 15.92% |
| Monday.Com Ltd | 116.07 | 5.81 | 6.50 | 1.06% | $0.0 | $0.28 | 26.24% |
| Dolby Laboratories Inc | 24.37 | 2.32 | 4.61 | 1.89% | $0.06 | $0.27 | 0.73% |
| CommVault Systems Inc | 71.47 | 26.35 | 5.20 | 5.12% | $0.02 | $0.22 | 18.39% |
| Qualys Inc | 25.39 | 8.87 | 7.36 | 9.7% | $0.06 | $0.14 | 10.41% |
| Teradata Corp | 25.21 | 12.98 | 1.79 | 20.25% | $0.09 | $0.25 | -5.45% |
| Average | 54.74 | 17.55 | 7.16 | 10.89% | $1.12 | $1.73 | 14.32% |
Key Insights from Microsoft’s Financial Metrics
- Price to Earnings (P/E): Microsoft’s P/E ratio stands at 33.63, which is 0.61 times lower than the industry average. This suggests the stock could offer growth potential at a reasonable valuation, making it attractive to investors.
- Price to Book (P/B): With a P/B ratio of 9.68, or 0.55 times the industry average, Microsoft appears undervalued relative to its peers.
- Price to Sales (P/S): The company’s P/S ratio of 12.01 is 1.68 times higher than the sector average, which may indicate the stock is priced at a premium based on its sales.
- Return on Equity (ROE): Microsoft’s ROE is 7.85%, which is 3.04% below the industry average, pointing to less effective use of equity to generate profits compared to competitors.
- EBITDA: The company reports an EBITDA of $48.06 billion, an impressive 42.91 times greater than the industry average, highlighting strong profitability and robust cash flow.
- Gross Profit: With gross profit at $53.63 billion, or 31 times the industry average, Microsoft demonstrates significant earnings from its core business operations.
- Revenue Growth: Microsoft’s revenue growth rate of 18.43% surpasses the industry average of 14.32%, reflecting strong demand and exceptional sales performance.
Debt-to-Equity Ratio Analysis
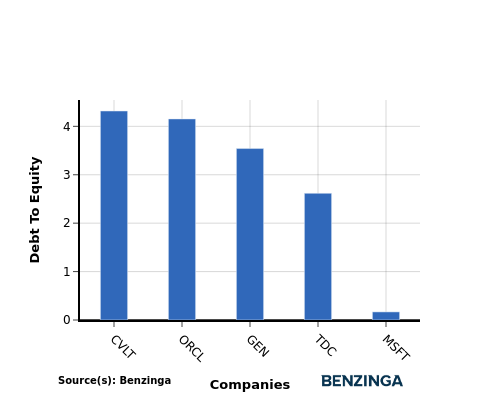
The debt-to-equity ratio measures how much a company relies on debt versus equity to finance its assets and operations. Comparing this ratio across industry peers provides a clear picture of a company’s financial stability and risk profile.
- Microsoft’s debt-to-equity ratio is 0.17, which is lower than its top four competitors, indicating a stronger balance sheet and less reliance on debt financing.
- This lower ratio suggests Microsoft maintains a healthier mix of debt and equity, which is generally viewed favorably by investors.
Summary and Conclusions
Microsoft’s relatively low P/E and P/B ratios point to potential undervaluation compared to other software companies, while its elevated P/S ratio reflects the market’s premium on its revenue. Although its ROE is lower than the industry average, the company’s high EBITDA, gross profit, and robust revenue growth underscore its strong financial health and promising outlook for future expansion.
This content was produced using Benzinga’s automated content platform and has been reviewed by an editor.
Disclaimer: The content of this article solely reflects the author's opinion and does not represent the platform in any capacity. This article is not intended to serve as a reference for making investment decisions.
You may also like
China is able to take advantage due to Trump's trade protectionism

DTCC emphasizes interoperability over closed networks in tokenization
WeLab’s $220M Raise Shows Institutional Bet on Asia Fintech