GBP/USD steady around 1.3450 as weaker US CPI boosts expectations for a 2026 Fed rate cut

British Pound Edges Lower but Remains Stable After US Inflation Data
The British Pound slipped slightly on the day, hovering close to where it opened on Tuesday. This comes after the latest US inflation figures suggested the Federal Reserve may continue to loosen monetary policy in 2026. At present, GBP/USD is trading at 1.3450, reflecting a minor decline of 0.03%.
Sterling Maintains Ground as US Inflation Slows, Fed Easing Anticipated
December’s US Consumer Price Index (CPI) rose by 0.3% month-over-month. On a yearly basis, CPI climbed 2.7%, matching November’s pace. Core CPI also held steady at 0.2% for the month, while the annual core figure came in at 2.6%, slightly below the expected 2.7%.
Despite the encouraging inflation numbers, investors do not foresee a rate cut from the Fed at its January meeting, especially after recent disagreements between Fed Chair Jerome Powell and the Trump administration.
Fed Officials and UK Economic Outlook
St. Louis Fed President Alberto Musalem commented that the US economy is likely to expand at or above its potential. He noted that inflation remains closer to 3% than 2%, but is expected to ease over the year. Musalem also stated that current policy is appropriate and supported a rate cut in December due to increased risks in the labor market.
In the UK, there are no major economic releases scheduled, with traders awaiting Thursday’s Gross Domestic Product (GDP) report. November’s GDP is forecast to be flat at 0%, which would mark an improvement from October’s 0.1% contraction.
Looking ahead in the US, Wednesday’s calendar includes Producer Price Index (PPI) data for October and November, as well as November’s Retail Sales figures.
GBP/USD Technical Analysis: What’s Next?
The daily chart for GBP/USD indicates the pair is consolidating between 1.3390 and 1.3498, with resistance at the 1.35 level and the 200-day Simple Moving Average (SMA) at 1.3388 acting as support.
- If bulls manage to push above 1.3500, the next target would be the yearly high at 1.3567, followed by 1.3700.
- If sellers drive the price below 1.3400, the pair could test the 200-day SMA, with additional downside risk toward the 100-day SMA at 1.3369.
GBP/USD daily chart
Disclaimer: The content of this article solely reflects the author's opinion and does not represent the platform in any capacity. This article is not intended to serve as a reference for making investment decisions.
You may also like
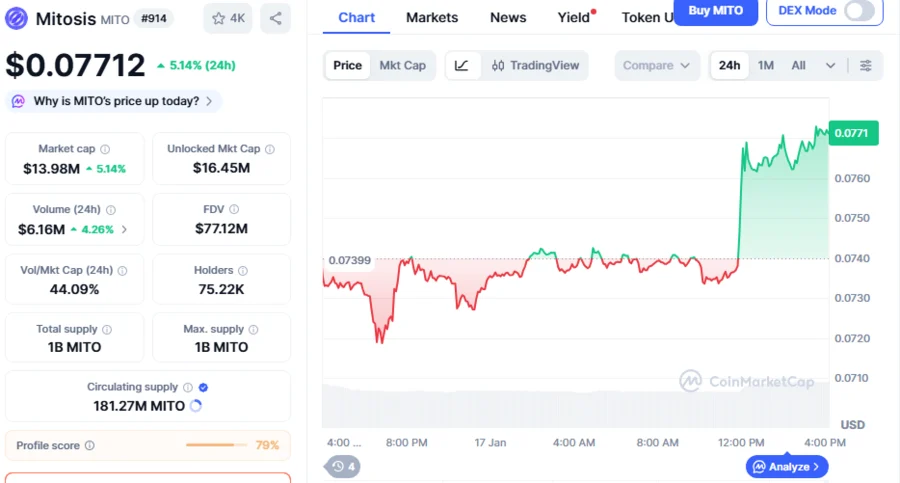
Mitosis Price Flashes a Massive Breakout Hope; Cup-And-Handle Pattern Signals MITO Targeting 50% Rally To $0.115305 Level
Recent financial moves by Trump spark renewed worries about possible conflicts of interest
Why Quant (QNT) Price Is Rising Today: Can It Hit $100 This Weekend?

XRP Price Prediction January 2026: Onchain Signals Elevating XRP Rally Odds