
New York Fed Scholar: "A New Labor Market Tightness Indicator for Predicting Wage Inflation"

Note: This article is authored by three economists from the Labor and Product Market Studies section of the Research and Statistics Group at the Federal Reserve Bank of New York: Sebastian Heise, Jeremy Pearce, and Jacob P. Weber, and was posted on the New York Fed website on October 9, 2024. The original title isA New Indicator of Labor Market Tightness for Predicting Wage Inflation.
A key issue in economic policy is how labor market tightness affects wage inflation and ultimately prices. In this article, we highlight the importance of two tightness indicators in determining wage growth:the quits rate (the quits rate), and the "vacancies per searcher" (vacancies per searcher, V/S)—where searchers include both employed and non-employed job seekers. Among a wide range of indicators, we find that these two are each independently most strongly correlated with wage inflation. We have constructed a new index, called the HPW Tightness Index (Heise-Pearce-Weber Tightness Index), which is a composite indicator of the quits rate and“vacancies per searcher”, and shows it performs best in explaining U.S. wage growth, including during the COVID pandemic and recovery period.
The Importance of On-the-Job Search for Labor Market Tightness
Labor market slack is usually measured by the unemployment rate or the "vacancy-to-unemployment ratio" ( the vacancy-to-unemployment ratio). In a recent staff report (Heise, Pearce, and Weber, 2024), based on the theoretical framework by Bloesch, Lee and Weber (2024), we argue that wage inflation should instead be strongly correlated with the quits rate and“vacancies per searcher”. The key argument is that on-the-job search is important for understanding labor market tightness: since most new hires come from other jobs rather than unemployment, measuring labor market tightness appropriately must include on-the-job seekers. Therefore, labor market tightness should be measured by“vacancies per searcher”, where searchers include employed, unemployed, and non-employed job seekers, rather than just the "vacancy-to-unemployment ratio" or the unemployment rate.
The intuition behind this argument is that when the “vacancies per searcher” is high, competition for workers prompts firms to raise wages to stay competitive. At the same time, workers have more opportunities to switch jobs, leading to higher quits rates. Therefore, the quits rate and “vacancies per searcher” are key components of the wage Phillips curve, and empirically more informative than the unemployment rate or other slack indicators.
Our recent Staff Report confirms this prediction in U.S. data. Crucially, we define job seekers as a weighted sum of short-term and long-term unemployed, employed, and non-employed people, with weights based on estimated search intensities of these different workers. We then show that the quits rate and “vacancies per searcher” outperform other standard measures of labor market tightness as predictors of wage growth. The table below demonstrates this by reporting simple univariate regression results for the U.S. wage Phillips curve, ranking the indicators by their ability to fit U.S. wage data (since 1990). We regress three-month wage growth from the Employment Cost Index (Employment Cost Index, ECI) on each of the indicators listed, standardizing them to mean zero and standard deviation one to facilitate coefficient comparison. The “coefficient” column presents the estimated coefficient, and the “fit” column shows regression fit.
We also construct a composite indicator of labor market tightness that takes a weighted average of the quits rate and “vacancies per searcher”, using the regression coefficients from wage growth on these two variables as weights. This composite index, which we call the “HPW Tightness Index,” ranks first in the table below, indicating its superiority over all other single variables. According to the “fit” column, it explains about 60% of wage growth during our sample period. The regression coefficients indicate that a one standard deviation increase in the index raises wage growth by 0.21 percentage points.
The quits rate and“vacancies per searcher”outperform other measures of labor market tightness
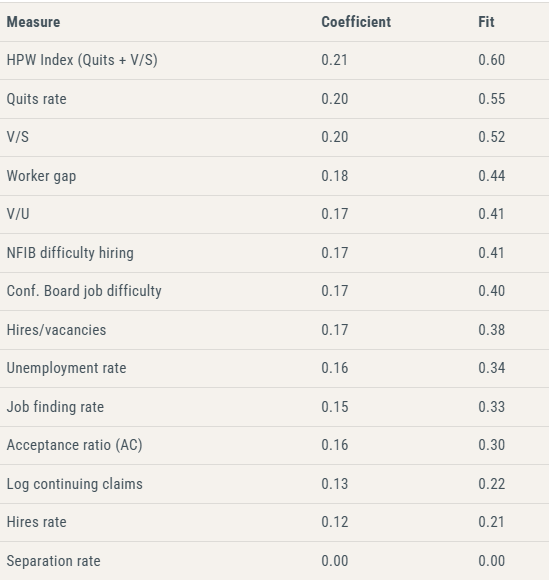
Source: Authors' calculations.
Note: The “coefficient” column reports the increase in wages (percentage points) caused by a one standard deviation increase in each indicator, while the “fit” column reports the R-squared of the simple time-series regression. All tightness indicators are sorted by fit. Estimates use data from 1990Q2 to 2024Q2, or a shorter period where quits data or other data are only available for a shorter span. We compare the quits rate and“vacancies per searcher”with the following other measures of labor market tightness: worker gap (vacancies - unemployment)/labor force; vacancies divided by unemployment rate; perceived worker availability from the NFIB survey; perceived job availability from the Conference Board's consumer survey; hires-to-vacancies ratio; unemployment rate; the job-finding rate; the acceptance rate of job-to-job transitions relative to unemployment-to-employment transitions (Moscarini and Postel-Vinay, 2023); log of continuing unemployment insurance claims; the hires rate; and the separation rate. Wages are measured using the Employment Cost Index. See Heise, Pearce and Weber (2024) for details.
The following figure visually demonstrates the fit of the HPW Index by plotting it against wage growth (measured as a three-period moving average of ECI three-month growth), with both series normalized to mean zero and variance one for comparison. We compare our indicator to a common measure of labor market tightness: the Conference Board’s survey measure of consumer perceptions of job availability. The Conference Board indicator and the HPW Index both tracked wage growth well in the pre-pandemic period. However, during the pandemic, our indicator performed noticeably better.
The HPW Index tracks wage growth well even during COVID
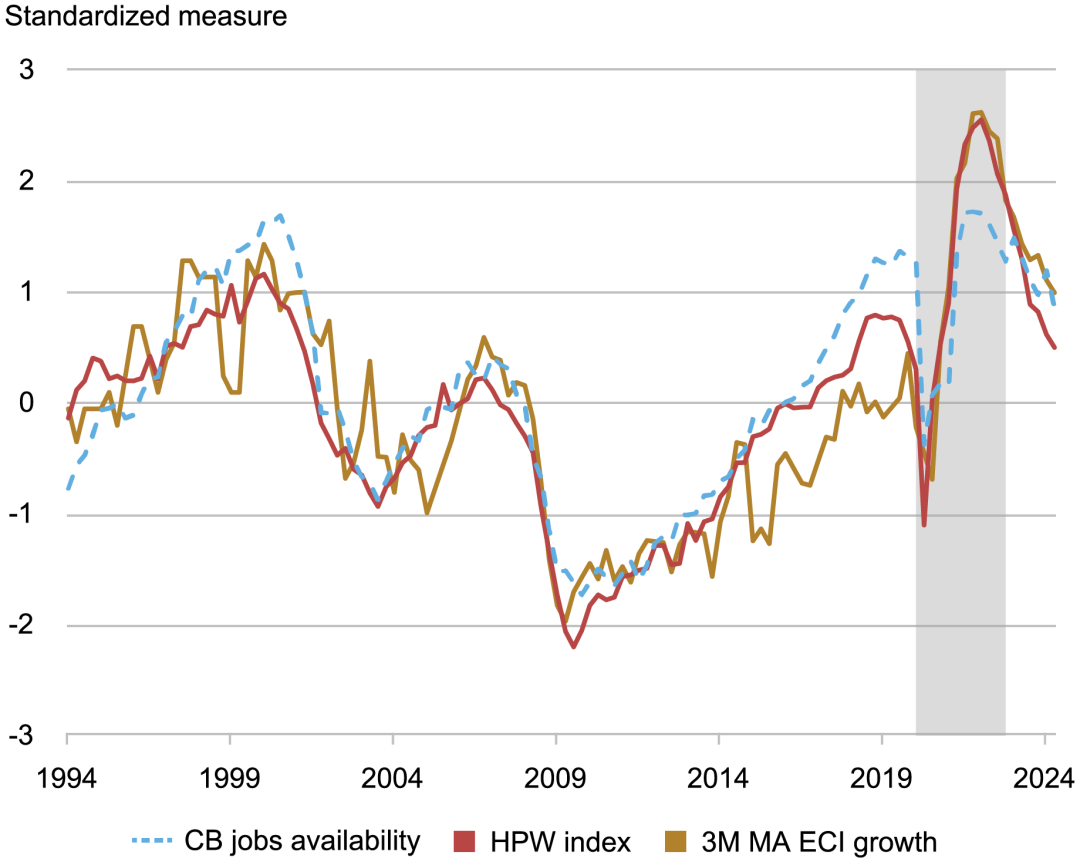
Source: Authors' calculations.
Note: The HPW Tightness Index, based on the quits rate and“vacancies per searcher”, tracks wage growth well even during the COVID pandemic and recovery. All series are normalized to mean zero and variance one for comparison. Wage growth is measured using the Employment Cost Index. “CB Job Availability” is taken from the Conference Board. The COVID period and recovery (2020Q1 to 2022Q4) are shaded.
No Evidence of Nonlinearity in Wage Inflation
Given recent interest in the nonlinear effects of labor market tightness on price inflation (Benigno and Eggertsson, 2024), we also analyzed whether there is a nonlinear relationship between labor market tightness and wage inflation. The results show no evidence of nonlinearity. In fact, there is nothing unusual in the wage/tightness relationship, whether during the extremely tight post-COVID period or after. This can be seen in the figure below, where we provide a scatterplot of the HPW Tightness Index against wage inflation. We find an almost linear relationship between the two variables.
No evidence of a nonlinear relationship between wage growth and labor market tightness
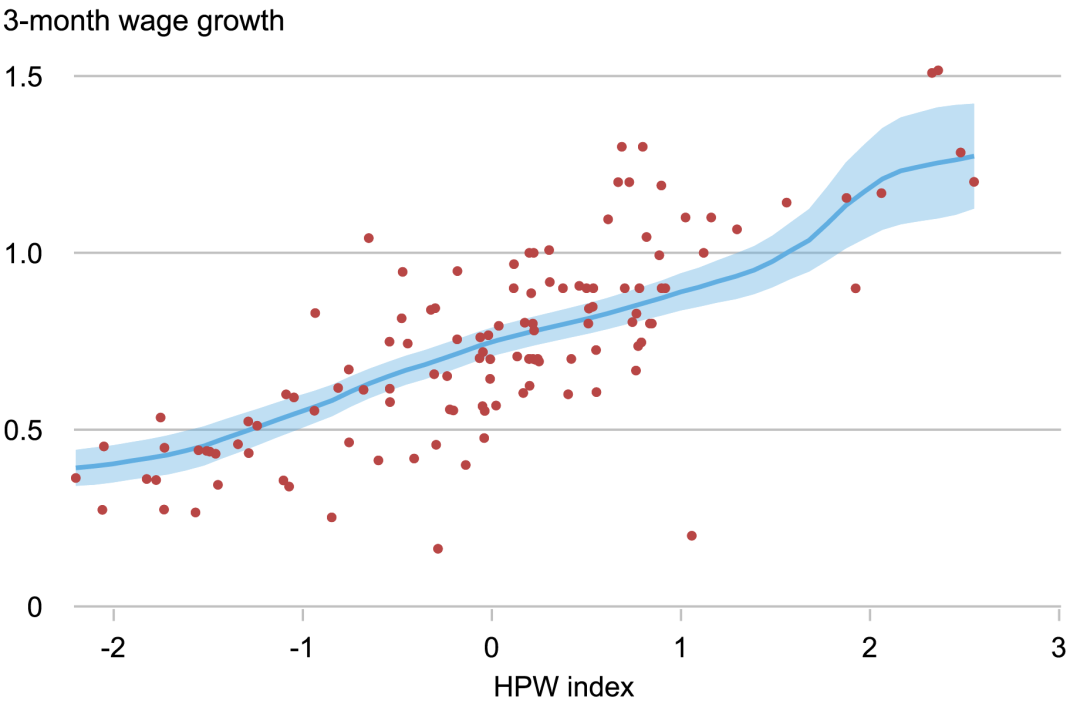
Source: Authors' calculations.
Note: The relationship between the HPW Tightness Index and nominal wage growth appears linear. Wages are measured using the Employment Cost Index. The line fit is a locally weighted polynomial fit.
Conclusion
In summary, the HPW Tightness Index, based on the quits rate and“vacancies per searcher”, performs well in summarizing labor market tightness for determining wage inflation, consistent with the theoretical findings of Bloesch, Lee and Weber (2024). This relationship remains robust during the COVID period and recovery, suggesting that the documented empirical relationship is resilient even to large, unusual economic shocks.
Citation format for this article:
Sebastian Heise, Jeremy Pearce, and Jacob P. Weber, “A New Indicator of Labor Market Tightness for Predicting Wage Inflation,” Federal Reserve Bank of New York Liberty Street Economics
Disclaimer: The content of this article solely reflects the author's opinion and does not represent the platform in any capacity. This article is not intended to serve as a reference for making investment decisions.
You may also like
Crypto Markets Brace for Turbulent Times as US-EU Tensions Escalate
Ethereum may finally kill “trust me” wallets in 2026, and Vitalik says the fix is already shipping
KLA Corp. Shares Receive Highest Price Target Yet—Is Now the Time to Invest in KLAC?
Bessent: Supreme Court reversal of tariffs is improbable, as they are a key element of Trump’s economic agenda