
XRP Price Sheds Monthly Sideways Trend to Reveal a $2.80 Bullish Core

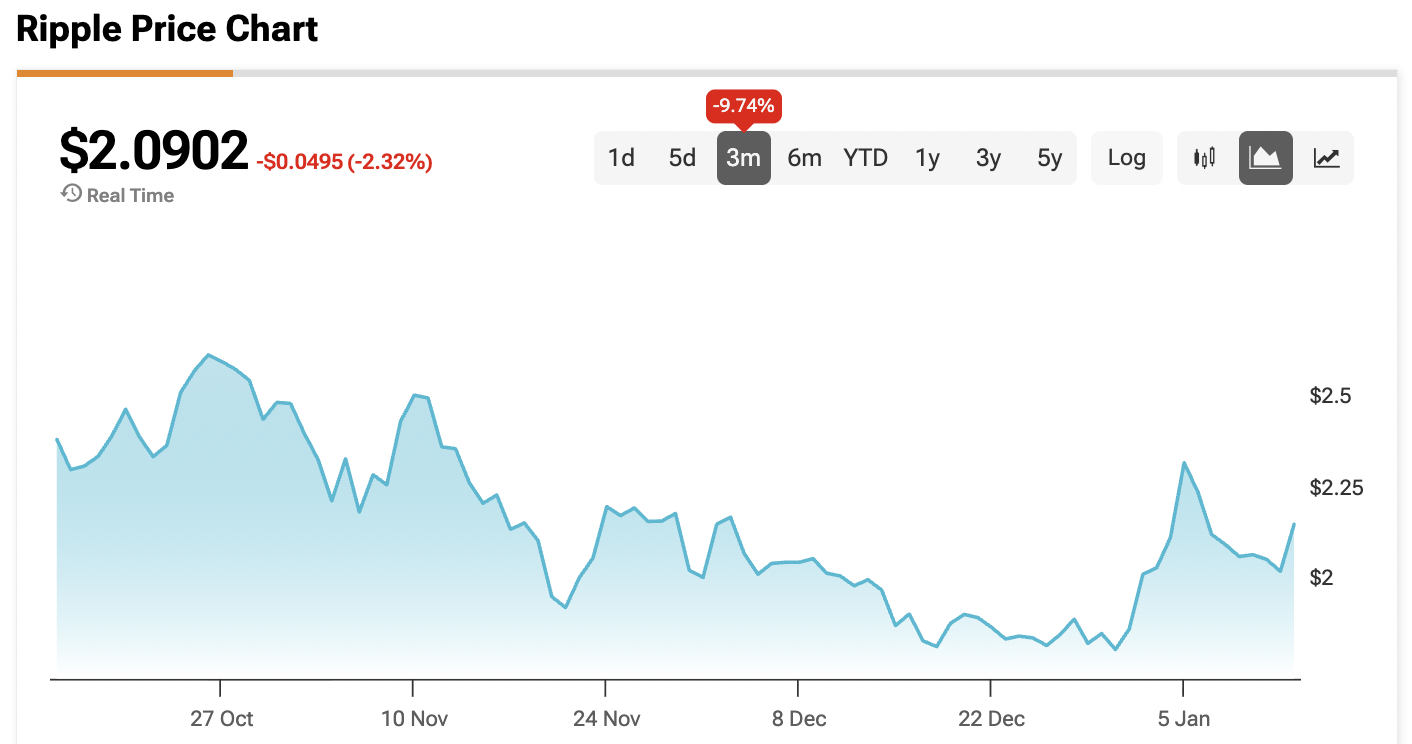
XRP (XRP-USD) is showing strong signals for a potential breakout as the middle of January 2026 approaches. Technical and on-chain indicators suggest that the token could be preparing for a rally toward $2.80 by the end of the month. Currently trading around $2.09, XRP is basically testing a major mental hurdle that will likely decide which way the wind blows for the next few months.
Claim 70% Off TipRanks Premium
- Unlock hedge fund-level data and powerful investing tools for smarter, sharper decisions
- Stay ahead of the market with the latest news and analysis and maximize your portfolio's potential
Three XRP Charts Point Upward
Technical traders are currently monitoring three distinct setups that all suggest a move toward the $2.70 to $2.80 range.
- The Two-Day Falling Wedge: On January 1, XRP broke out of a classic falling wedge pattern, which typically signals that sellers are exhausted. For this move to stay valid, the price must remain above the $2.00 support level.
- The Eight-Hour Bull Flag: Zooming into shorter timeframes, a bull flag”has formed. If the price can close an eight-hour candle above $2.15, it clears a path toward the flag’s measured target of $2.80, a potential 32.5% gain from current levels.
- The Daily Descending Channel: A decisive break above the $2.30 line on the daily chart would confirm a major trend change, potentially triggering an influx of short covering as bearish traders are forced to buy back their positions.
XRP’s On-Chain Signals Flash Bullish
The Spot Taker Cumulative Volume Delta (CVD) is one of the most bullish internal metrics for XRP right now. This metric tracks the net difference between “market buy” and “market sell” orders. Since November 2025, the CVD has remained consistently positive, indicating that buyers are aggressively absorbing available supply.
Historical data shows that a similar surge in spot CVD occurred in July 2025, which preceded a 65% price rally within just a few weeks. This demand-side pressure is being reinforced by the successful launch of Spot XRP ETFs, which have brought in over $1.3 billion in net inflows since their debut late last year.
In short, XRP is currently in a make or break spot. While the crypto market can be unpredictable, the combination of people buying in at market price and these specific chart patterns suggests that a big move could be just around the corner. If the price can comfortably stay above the $2.00 mark and break through a few more hurdles, that $2.80 target by the end of the month looks more and more like a real possibility.
At the time of writing, XRP is sitting at $2.09.
Copyright © 2026, TipRanks. All rights reserved.
Disclaimer: The content of this article solely reflects the author's opinion and does not represent the platform in any capacity. This article is not intended to serve as a reference for making investment decisions.
You may also like
AutoStaking and Conflux Network Collaborate – Layer-1 Payments on DeFi with AI
Zuckerberg’s Threads starts 2026 ahead of Musk’s X in user count
Bitcoin Sees $1.65B Exodus From Exchanges as Holders Move to Cold Storage