Cass TL Linehaul Index rises even as shipment volumes decrease

Freight Shipments Hit New Lows as Truckload Rates Rise
According to the latest monthly figures from Cass Information Systems, December saw shipment volumes drop to their lowest point in the current cycle, while truckload rates continued to climb.
The Cass multimodal shipments index recorded a 7.5% decrease compared to the previous year for December. This decline followed a similar drop in December 2024, resulting in a cumulative two-year decrease of 13.5%. Compared to November, shipments were down 7.2% (or 3.2% lower when adjusted for seasonality).
Key December 2025 Metrics
- Year-over-year change
- Two-year comparison
- Month-over-month change
- Seasonally adjusted month-over-month
- Shipments
- Expenditures
- Truckload Linehaul Index
Winter weather was cited as a major factor behind the reduced shipment volumes, though the report also noted that inventory levels have been depleted.
“Three significant winter storms impacted the Midwest during the first half of December, disrupting highway traffic and creating pent-up demand that lingered in the spot market into early January,” the report stated. “Retail inventory levels have been reduced in recent months, as freight movement across all modes lagged behind consumer spending.”
January has experienced relatively mild weather so far. If these conditions persist, shipment volumes could exceed the typical seasonal decline of 5%.
During a recent analyst call, J.B. Hunt Transport Services (NASDAQ: JBHT) reported that market conditions began to tighten just before Thanksgiving and continued through year-end. The company’s leadership refrained from making firm predictions for 2026, citing ongoing market volatility, but noted that the early-year strength in demand has not been driven by adverse weather. They also mentioned that customer inventories remain low.
SONAR: Van Outbound Rejection Index (VOTRI.USA) for 2026 (blue area), 2025 (yellow), 2024 (green), and 2023 (pink). This index, which reflects truck capacity, measures the percentage of dry van loads rejected by carriers. Recent data indicates a tightening truckload market.
SONAR: National Truckload Index (NTIL.USA, linehaul only) for 2026 (blue area), 2025 (yellow), 2024 (green), and 2023 (pink). The NTIL is calculated from spot dry van loads across 250,000 lanes and represents a seven-day moving average of linehaul rates, excluding fuel. Spot rates increased during peak season as new driver pool constraints emerged.
The Cass expenditures index, which tracks total freight spending including fuel, slipped 0.6% year over year. Compared to two years ago, expenditures were down 4%—the smallest two-year decline since July 2023.
In 2025, expenditures fell just 0.5% while shipments dropped by an average of 6%, suggesting that freight rates trended upward throughout the year. Adjusting for volume changes, rates likely rose 7% year over year in December.
(Cass is currently reviewing the effects of a shift from less-than-truckload to truckload freight and has temporarily suspended publication of its inferred rate data.)
The truckload linehaul index, which excludes fuel and additional surcharges, rose 1% from November, marking the fourth consecutive monthly increase. The index was up 2.1% year over year and remained positive throughout 2025.
The report attributed the rate increases to weather-related disruptions in December. It also noted that the mild start to the year has helped clear the backlog of shipments, but cautioned that the recent rate momentum may be short-lived as the market enters its slowest seasonal period. Still, it emphasized that inventories will eventually need to be restocked and that trucking capacity continues to shrink.
Additional Insights and Industry Trends
Some public carriers and third-party logistics providers have pointed to tighter driver regulations—including English proficiency requirements, restrictions on non-domiciled commercial licenses, and stricter enforcement of ELD and driver training rules—as contributing factors to recent changes in the spot market.
Truckload spot rates outperformed typical seasonal patterns during the final six weeks of the quarter, a trend that has continued into January despite the absence of weather-related capacity constraints.
“Although freight volumes remain soft, following significant inventory reductions in Q4 2025, we believe the Supreme Court’s decision on IEEPA tariffs could provide a boost to freight demand,” the report noted.
The data for these indexes is sourced from freight bills processed by Cass (NASDAQ: CASS), a leader in payment management solutions that handles $36 billion in freight payments annually for its clients.
Disclaimer: The content of this article solely reflects the author's opinion and does not represent the platform in any capacity. This article is not intended to serve as a reference for making investment decisions.
You may also like
Zero Knowledge Proof Secures AI and Enables Safe Decentralized Marketplaces for Monetizing Sensitive Data

Altcoin Market Sets Up for a Possible $1T Rotation — 5 Tokens Positioned for a 60% Breakout This Month
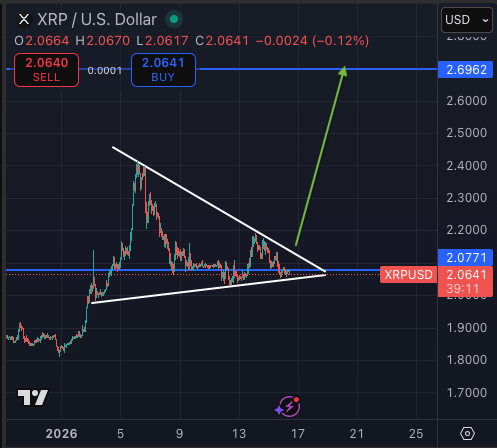
XRP Breakout Possible Before The Weekend, Expert Says
Crypto Market Review: Fake Bitcoin (BTC) Breakthrough; Shiba Inu (SHIB): Third Time's a Charm; XRP: 3 Price Waves