Date: Fri, Sept 12, 2025 | 09:58 AM GMT
The cryptocurrency market is showing strength amid the anticipated potential US Federal Reserve rate cuts, with Ethereum (ETH) reclaiming the $4,500 mark today. Following this, several major memecoins are flashing bullish signals — including Shiba Inu (SHIB).
SHIB has turned green with an 8% gain over the past week, and more importantly, its price chart is displaying a key harmonic structure that could be pointing to a larger upside move in the near term.
 Source: Coinmarketcap
Harmonic Pattern in Play
On the daily chart, SHIB is forming a Bearish Crab harmonic pattern — a setup which, despite its name, often sees strong bullish action during the CD leg before the final reversal zone. This leg is currently in progress.
The pattern started at point X near $0.00001598, dropped to point A, rallied to point B, and then declined again to point C around $0.00001177. After bottoming at C, SHIB regained upside momentum, reclaiming the 200-day moving average and currently trading near $0.00001331.
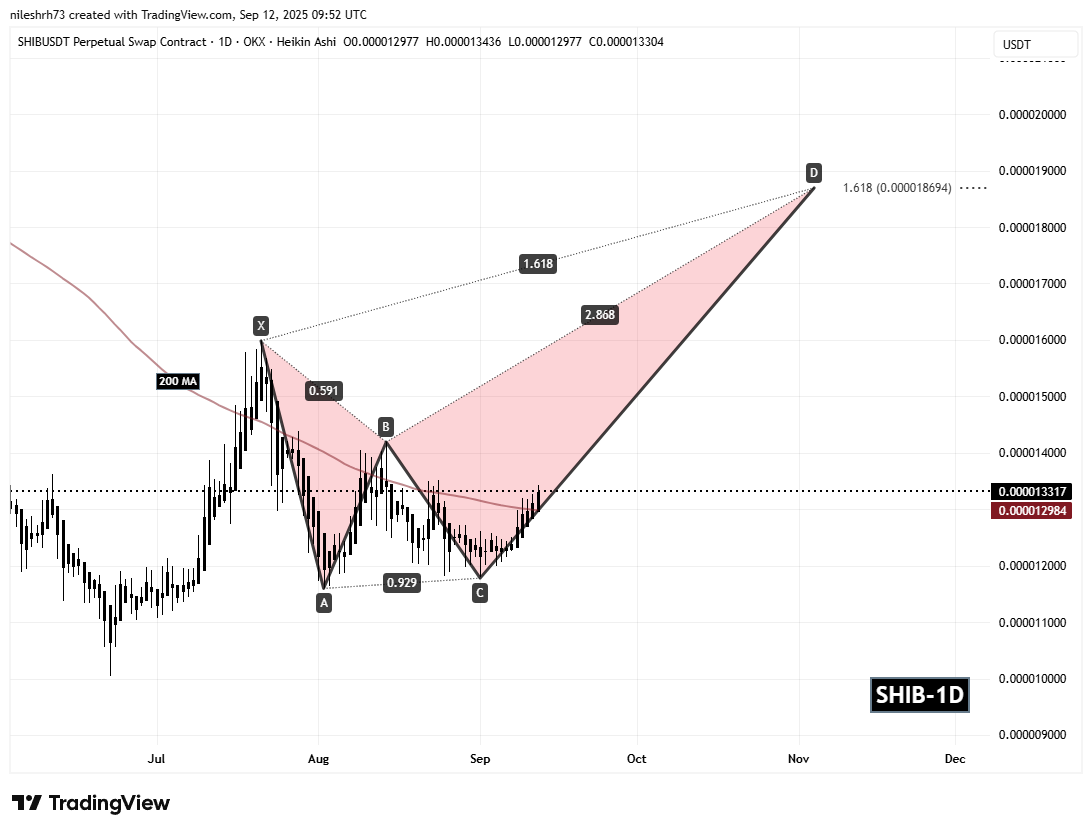 Shiba Inu (SHIB) Daily Chart/Coinsprobe (Source: Tradingview)
According to harmonic trading principles, the CD leg could extend toward the Potential Reversal Zone (PRZ) near $0.00001869, aligning with the 1.618 Fibonacci extension of the XA leg. If achieved, this would represent a potential 40% upside from current levels.
What’s Next for SHIB?
For SHIB to maintain this bullish trajectory, it must hold above the 200-day moving average ($0.000012984). Staying above this critical support could fuel further momentum, increasing the likelihood of a move toward the $0.00001869 target zone, where traders might expect resistance or profit-taking.
However, if SHIB fails to defend the 200-day MA, the setup could weaken, delaying or even invalidating the bullish outlook.

