
News
Stay up to date on the latest crypto trends with our expert, in-depth coverage.


Ahead of Tesla's annual shareholders meeting, Norway's sovereign wealth fund, with assets totaling 1.9 trillion, has publicly opposed Elon Musk's 100 million compensation package. Musk previously threatened to resign if the proposal was not approved.
Multiple negative factors are weighing on the market! Trading sentiment in the cryptocurrency market remains sluggish, and experts had previously warned of a potential 10%-15% correction risk.
The AI stock rally has been targeted by "the Big Short" investor! Scion Asset Management, led by Michael Burry, has made a major shift in its 13F holdings, taking short positions against Nvidia and Palantir. Not long ago, he broke his long silence to warn about a market bubble.

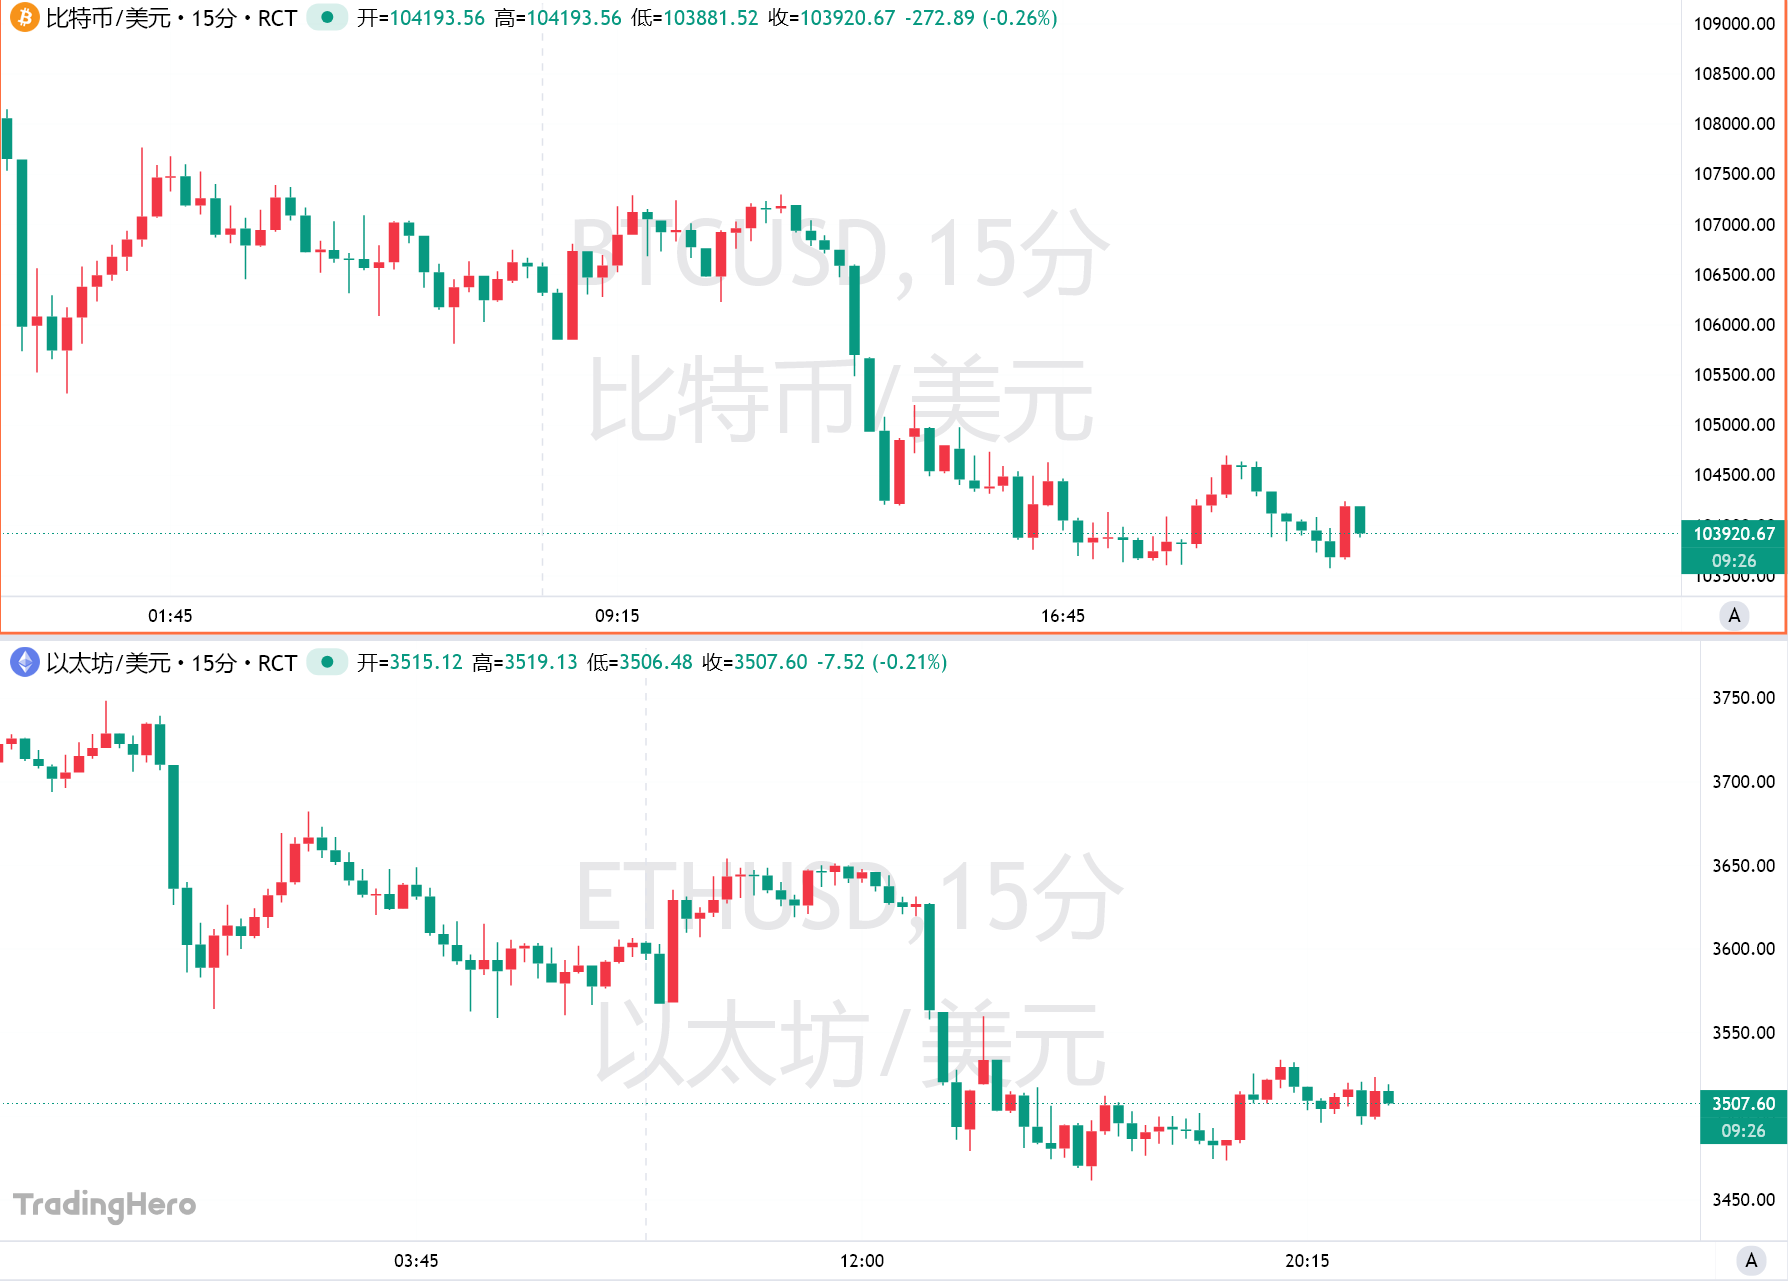
Key metrics (from 4:00 PM Hong Kong time on October 27 to 4:00 PM Hong Kong time on November 3): BTC/USD fell by 7.3%...
The market is not performing well; I wish you peace and safety.

- 17:06"Maji" long positions have been fully liquidated again, with the account balance now only $1,718.According to Jinse Finance, monitored by Lookonchain, "Maji" long positions have once again been completely liquidated. His account balance is now only $1,718.
- 17:05BTC falls below $101,900Jinse Finance reported that according to market data, BTC has fallen below $101,900 and is now quoted at $101,890.36, with a 24-hour decline of 4.45%. The market is experiencing significant volatility, so please ensure proper risk control.
- 16:48If bitcoin falls below $102,000, the cumulative long liquidation intensity on major CEXs will reach $454 millions.According to ChainCatcher, citing Coinglass data, if bitcoin falls below $102,000, the cumulative long liquidation intensity on major CEXs will reach $454 million. Conversely, if bitcoin breaks through $104,000, the cumulative short liquidation intensity on major CEXs will reach $186 million. Note: The liquidation chart does not show the exact number of contracts pending liquidation or the precise value of contracts being liquidated. The bars on the liquidation chart actually represent the relative importance, or intensity, of each liquidation cluster compared to neighboring clusters. Therefore, the liquidation chart demonstrates the extent to which the underlying price reaching a certain level will be affected. A higher "liquidation bar" indicates that once the price reaches that level, there will be a stronger reaction due to a wave of liquidity.